Johnson Controls International plc, (JCI) engages in engineering, manufacturing, commissioning & retrofitting building products & systems in United States & globally. It operates in four segments like Building Solutions in North America, Building Solutions EMEA/LA, Building Solutions Asia-Pacific & Global products. It comes under Industrials sector & trades as “JCI” ticker at NYSE.
JCI favors impulse rally in weekly against in III of (III) against October-2023 low. It favors upside in (5) targeting $151.45 – $159.38 area to end ((3)), while high comes with momentum divergence. We like to buy the pullback in 3, 7 or 11 swings in ((4)) later at extremes.
It ended (I) at $81.77 high in December-2021 & (II) at $45.52 low in July-2022. Above there, it placed I of (III) at $69.60 in January-2023, II at $47.90 low in October-2023 & favors rally in III. Within III, it ended ((1)) at $91.14 high, ((2)) at $68.03 low & favors upside in ((3)). Within ((1)) of III, it ended (1) at $74.23 high, (2) at $64.31 low, (3) at $87.16 high, (4) at $75.32 low & (5) at $91.14 high. Every time correction hits the blue box area, it reacted higher to extend bull run.
JCI – Elliott Wave Latest Weekly View: 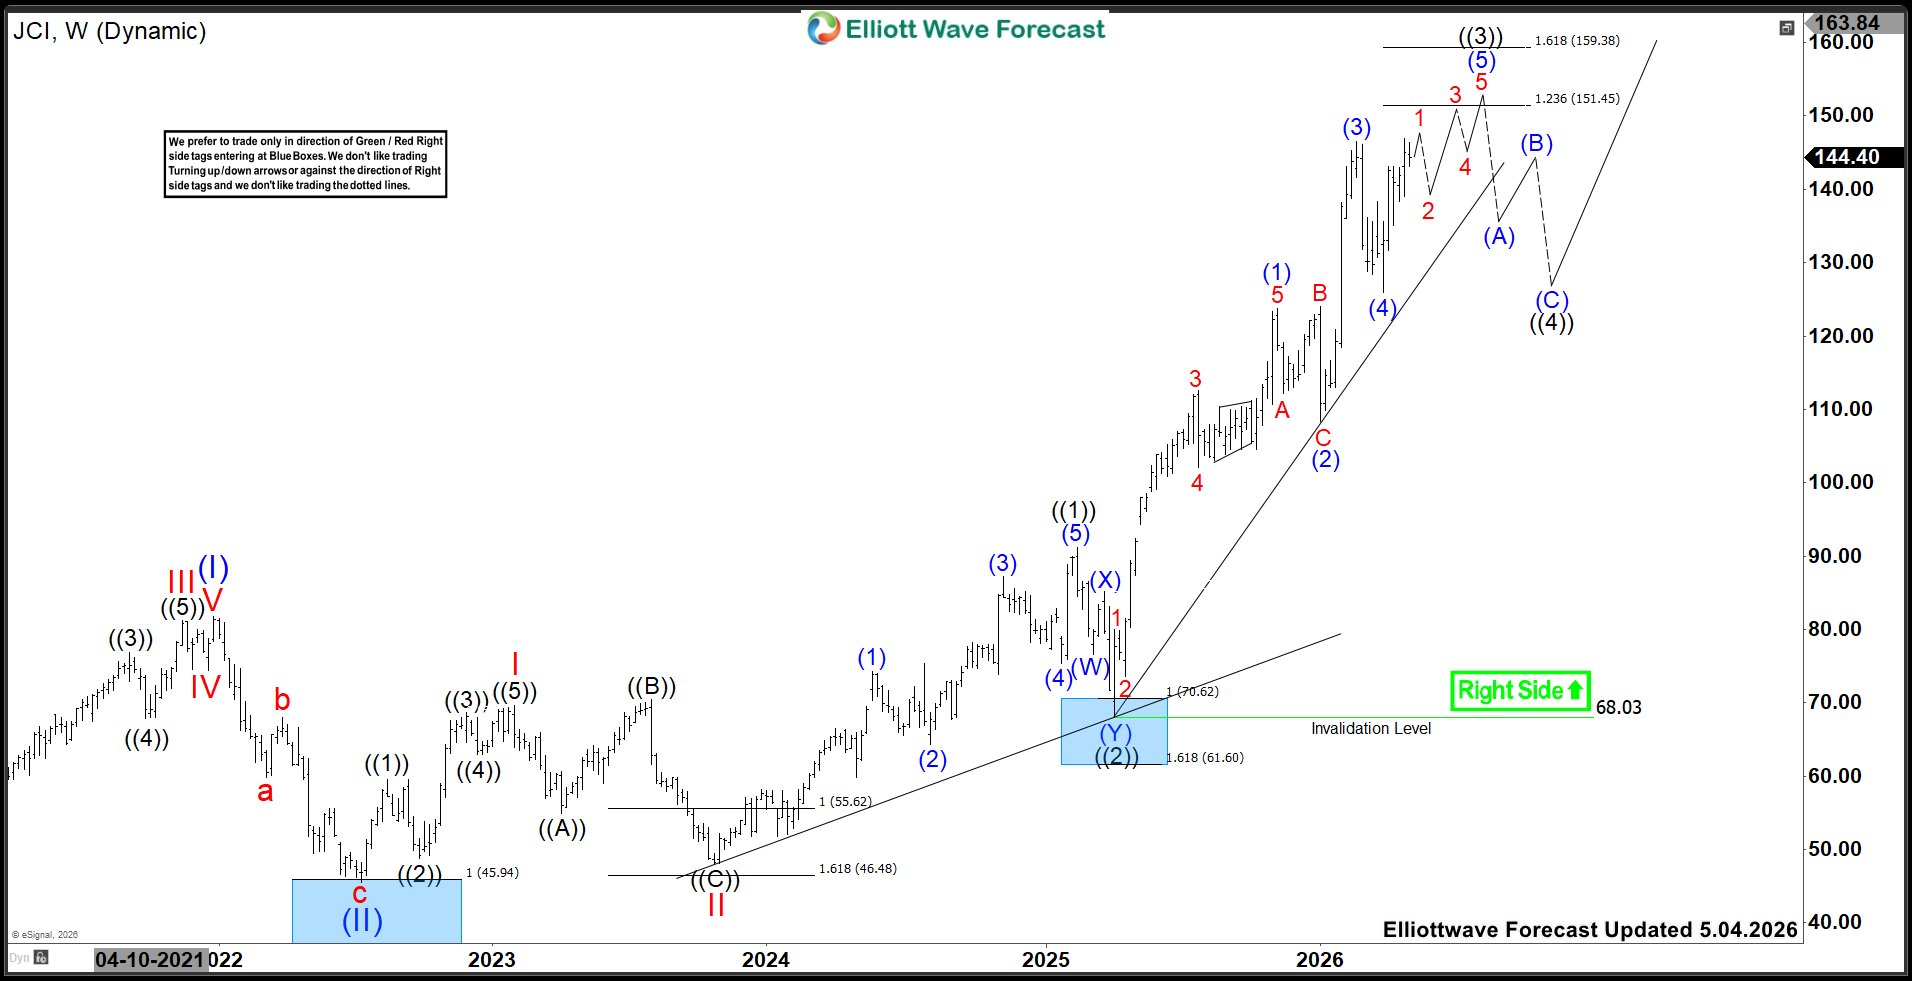
It ended (1) of ((3)) at $123.78 high, (2) at $108.41 low, (3) at $146.49 high, (4) at $125.91 low & favors upside in 1 of (5). It already broke to new high in (5) above $146.49 high of (3) & expect rally into $151.45 – $159.38 area to finish ((3)). The rally in ((3)) already crossed above 1.618 extension of ((1)) as $138.36 & expect to finish around $154.98 as 2.0. The high within ((3)) came with momentum divergence, indicates the trend may mature & pullback possible. So, chasing at current level cane be risky & buyers should wait for ((4)) pullback. The break below trendline will confirm the pullback. If it managed to erase the momentum divergence, then it can extend ((3)) in alternate scenario.
JCI is not the part of regular service at EWF. But we provide time to time updates on instruments under blog section. Elliottwave Forecast updates 1-hour charts four times a day & 4-hour charts once a day for all our 78 instruments. We do a daily live session, where we guide our clients on the right side of the market. In addition, we have a chat room where our moderators will help you with any questions you have about what is happening in the market at the moment. You can try us for 14 days for only $0.99 (limited time offer). Also, you can check out the Educational section to learn Elliott wave theory & its application through different packages available & 1-1 coaching for doubts.


