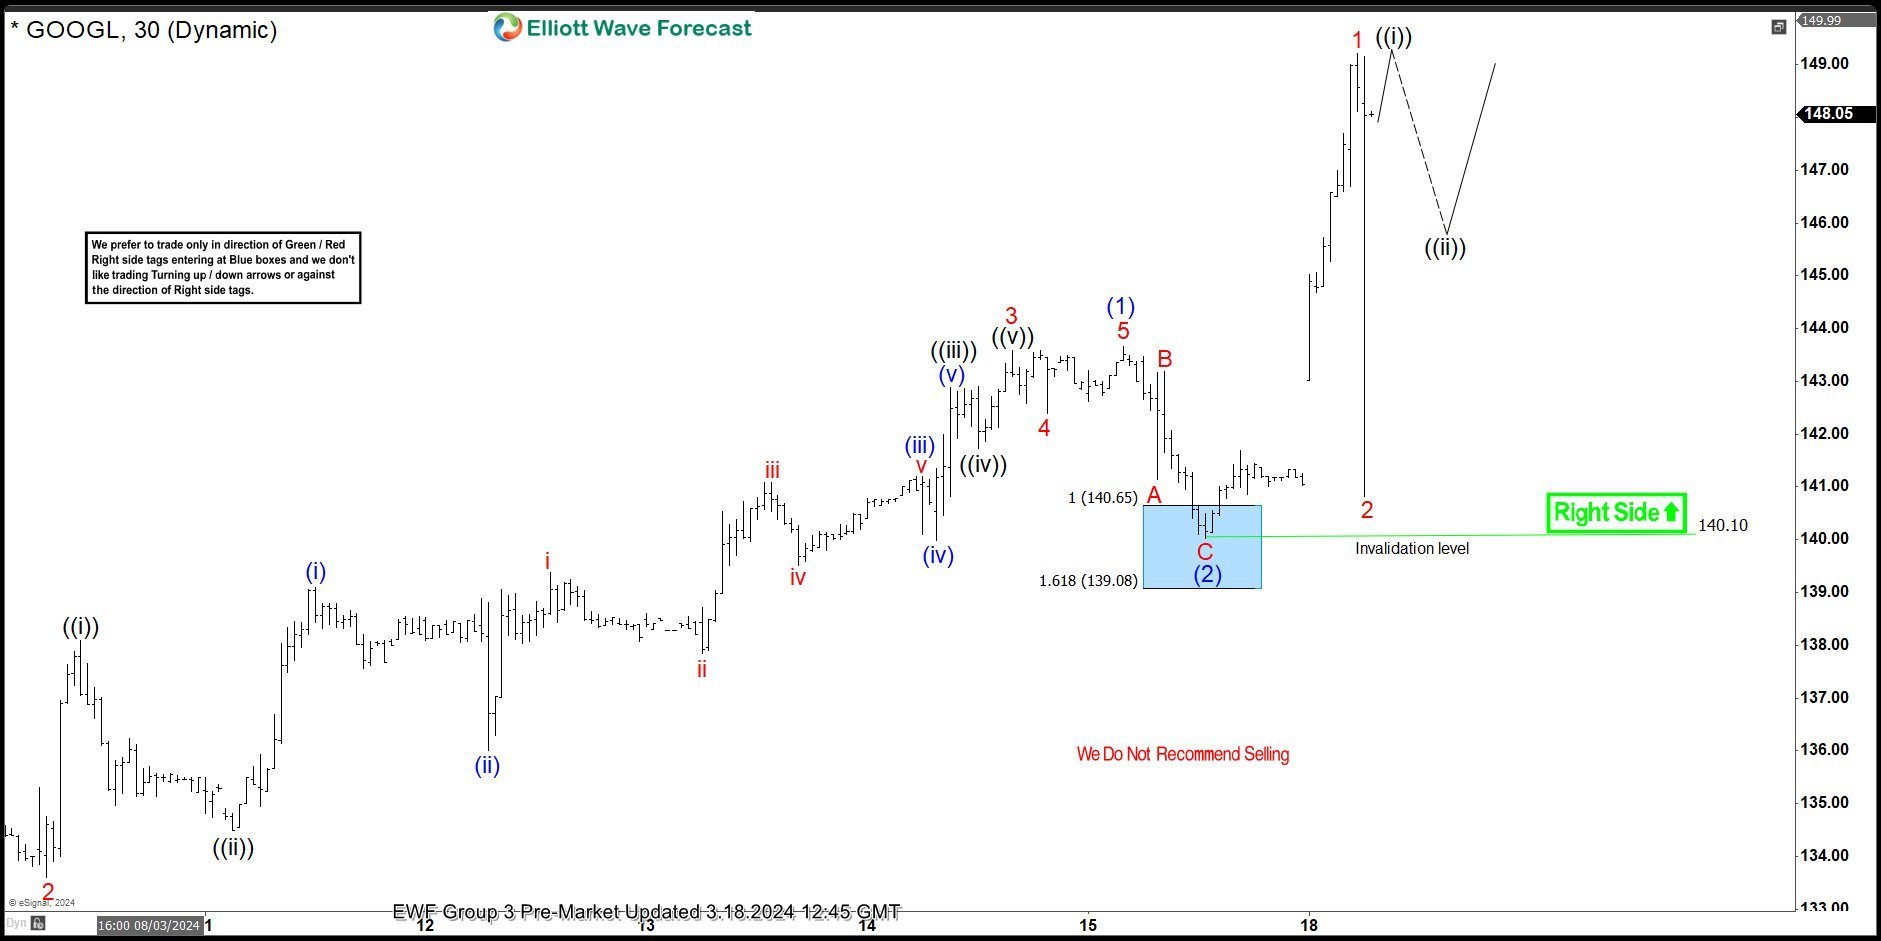
Hello fellow traders. In this technical blog we’re going to take a quick look at the Elliott Wave charts of $GOOGL Stock published in members area of the website. As our members know we have been favoring the long side in $GOOGL. Recently we got a pull back that has made a clear 3 waves pull back that found buyers right at the equal legs area. In the further text we are going to explain the Elliott Wave forecast
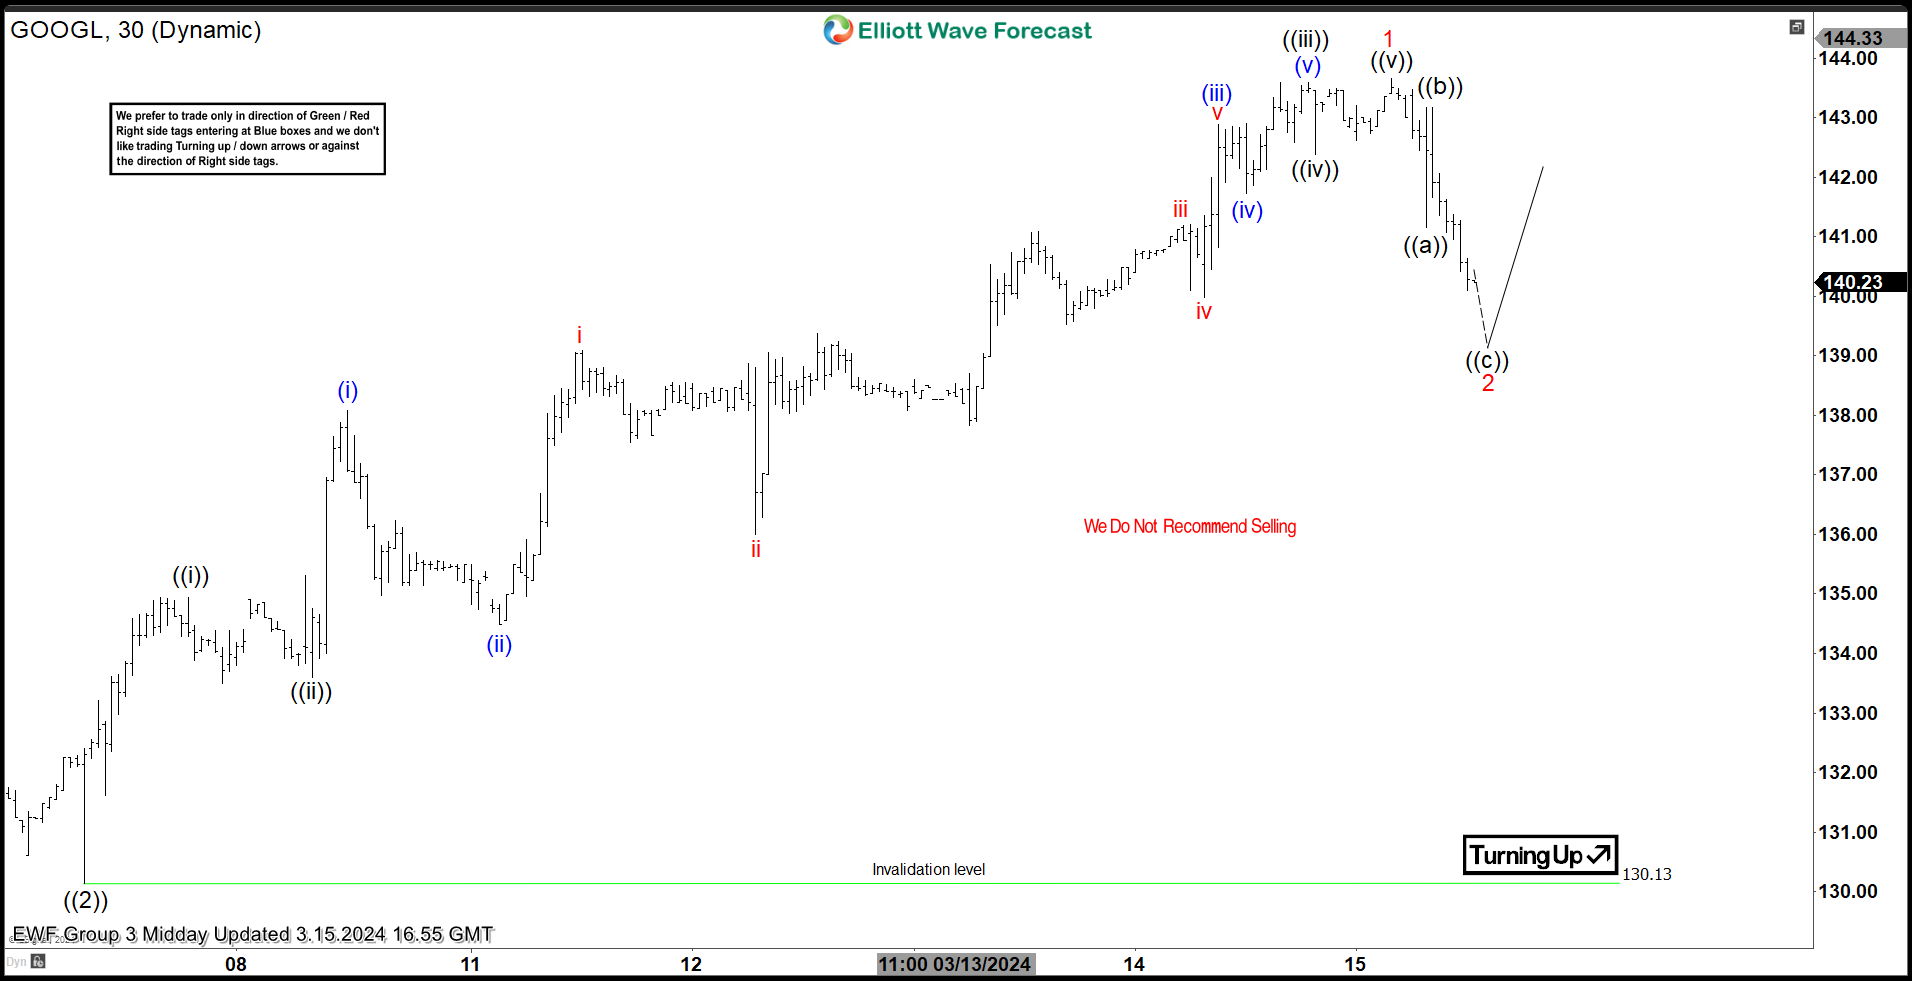
$GOOGL H1 Midday Update 03.15.2024
$GOOGL ended cycle from the 130.13 low as 5 waves structure. The stock is currently giving us pull back against the 130.130 low which can be unfolding as Elliott Wave Zig Zag pattern. Equal legs area from the peak is already reached at 140.65-139.08 . We are aware that pull back can complete any moment. For now, we see possibility of a more downside in near term. We don’t recommend selling the stock and expect further rally to resume from the mentioned zone.
Reminder : You can learn more about Elliott Wave Patterns at our Free Elliott Wave Educational Web Page.
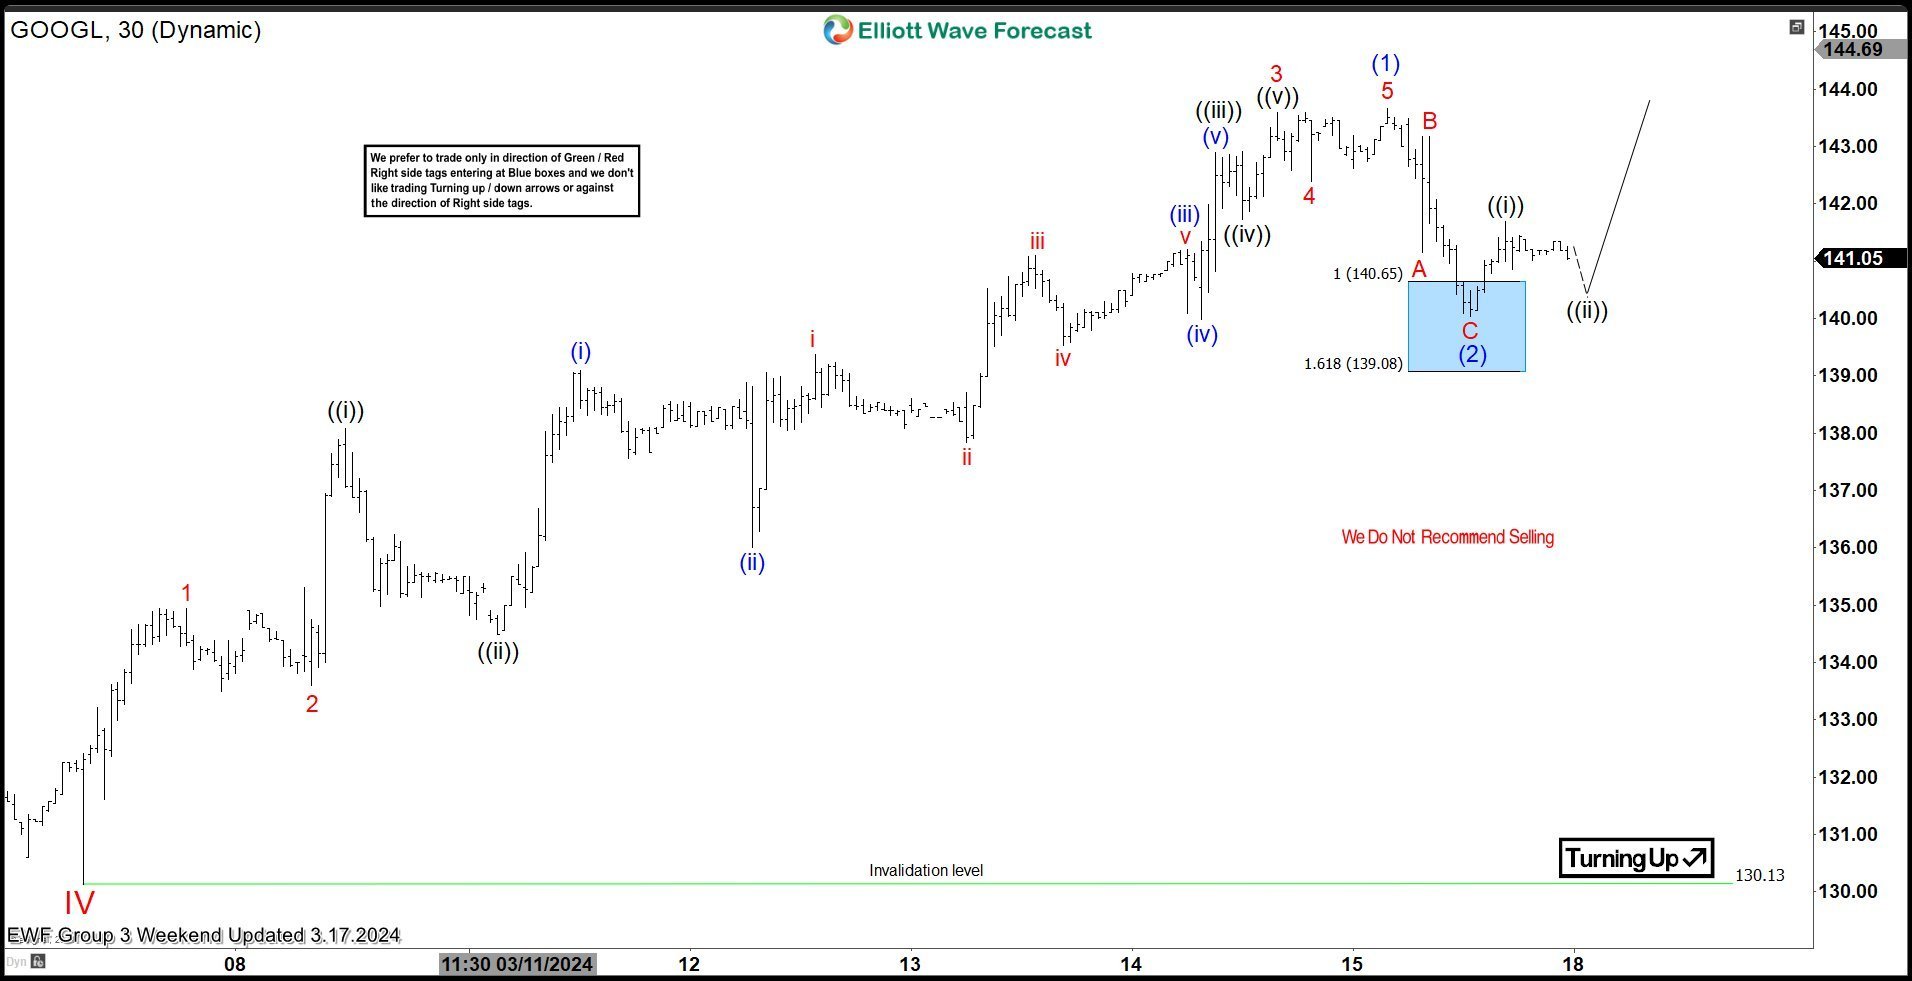
$GOOGL H1 Weekend Update 03.17.2024
The stock has made bounce from the extreme zone. We are calling wave (2) blue completed at the 140.10 low. As far as the price stays above that low, we can be doing wave (3) blue which is heading toward new highs ideally. We need to see break of (1) blue peak to confirm next leg up is in progress.
$GOOGL H1 Weekend Update 03.17.2024
$GOOGL has continued to rally from the marked extreme zone as expected. We got very good rally toward new highs and then sharp pull back which filled the gap. Now the stock remains bullish against the 140.1 pivot. We expect to see another intraday 3 waves pull back before further rally resumes. As far as pivot at 140.1 low holds, we expect the stock to keep finding buyers in 3,7,11 swings.
Keep in mind that market is dynamic and presented view could have changed in the mean time. You can check most recent updates in the membership area of the website. Remember that not every chart is trading recommendation. Best instruments to trade are those having incomplete bullish or bearish swings sequences. We put them in Sequence Report and best among them are shown in the Live Trading Room. You can check most recent charts in the membership area of the site.