The market remains under pressure, and that weakness drags AXP lower. However, the company shows strong operating momentum and steady premium‑client spending. Moreover, its revenue growth outlook for Q2 2026 stays firm. AXP shows strong fundamentals, but Elliott Wave signals a completed cycle and risk of a drop below 200.
Still, the current price ignores that strength. The stock reflects fear, not fundamentals. Yet the projected Q2 2026 numbers point to solid expansion and healthy margins. Therefore, AXP’s valuation looks disconnected from its real performance.
Elliott Wave Outlook: AXP Weekly Chart October 06th, 2025
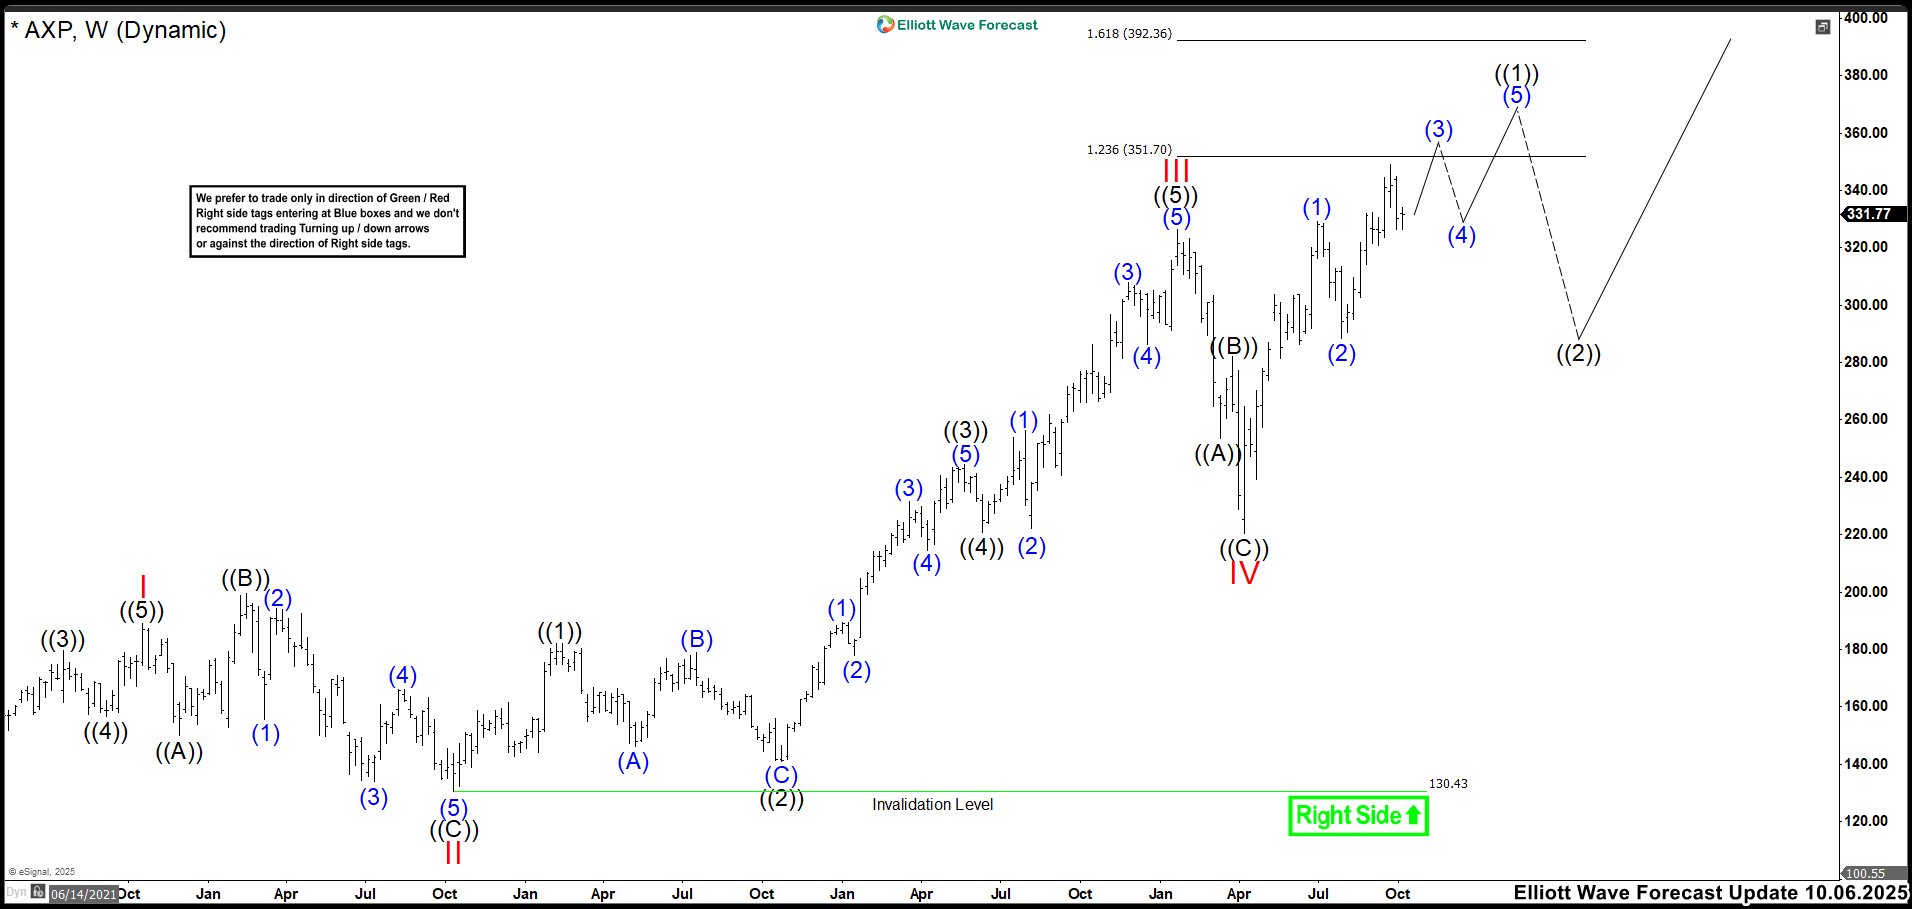
AXP continued rising after completing wave IV and broke above the wave III high. This confirms wave IV likely ended. Now, the market appeared to be unfolding wave ((1)) of V, showing bullish momentum. We expected an impulsive structure to complete the cycle soon. If the move was impulsive, the chart should reflect a clear five-wave pattern. However, if it was a leading diagonal, wave (3) may have ended, and wave (4) could be underway. Either way, we anticipated more upside toward the 351.70–392.36 zone. The key was identifying the Elliott structure that would offer the best exit before correction begins.
Elliott Wave Principle Behind the Market Structure
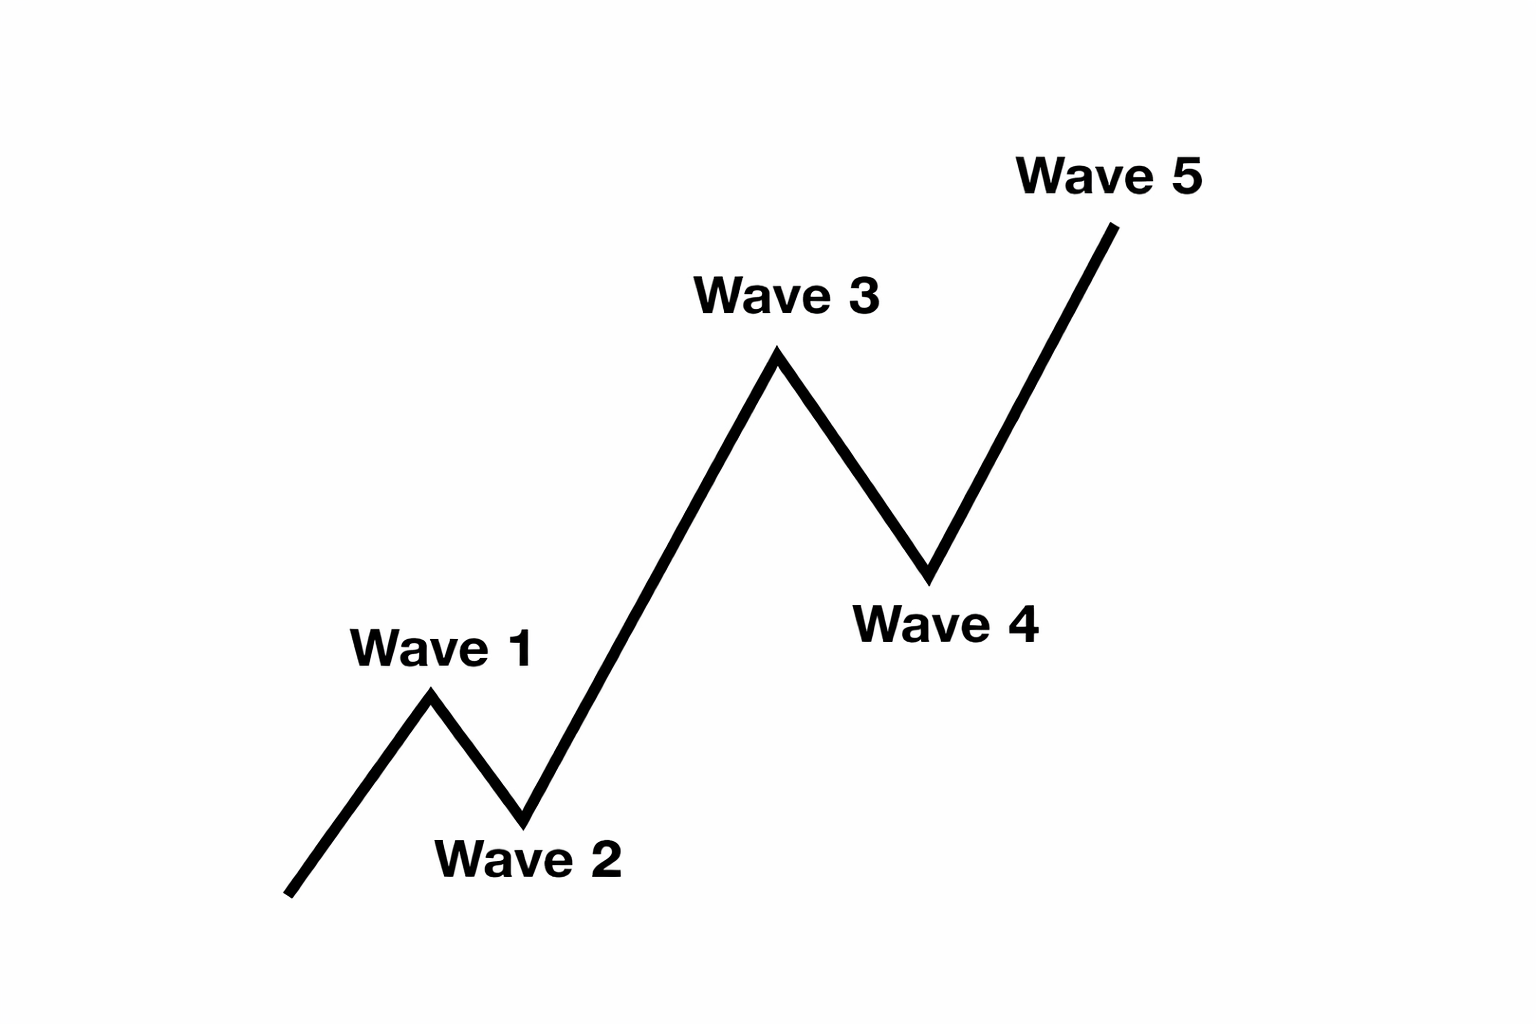
Impulse
An impulse is a clean 5‑wave pattern that drives the trend forward.
- Waves 1‑3‑5 are strong and directional.
- No overlap between waves 1 and 4.
- Wave 3 is usually the strongest.
- Structure is clear, with increasing momentum.
Elliott Wave Outlook: AXP Weekly Chart March 08th, 2026

In this AXP update, we see the market completing an impulse from April 2025. At first, we viewed this impulse as wave ((1)) and expected an extension. However, the reaction from the extreme zone signals the 2020 cycle has ended.
Now we watch for a strong rebound that confirms wave “a” has finished. Then we expect that rebound to fail and continue the decline. Therefore, we must stay alert because AXP shares could drop below 200 dollars.
Transform Your Trading with Elliott Wave Forecast!
Ready to take control of your trading journey? At Elliott Wave Forecast, we provide the tools you need to stay ahead in the market:
Blue Boxes: Stay ahead in the market with fresh 1-hour charts updated four times daily, daily 4-hour charts on 78 instruments, and precise Blue Box zones that highlight high-probability trade setups based on sequences and cycles.
Live Sessions: Join our daily live discussions and stay on the right side of the market.
Real-Time Guidance: Get your questions answered in our interactive chat room with expert moderators.
🔥 Special Offer: Start your journey with a 14-day trial for only $0.99. Gain access to exclusive forecasts and Blue Box trade setups. No risks, cancel anytime by reaching out to us at support@elliottwave-forecast.com.
💡 Don’t wait and get a DISCOUNT for any plan!
Click in the next link, go to Home Chat and ask for a flat discount code saying that you saw this in Luis’ Blog: 🌐


