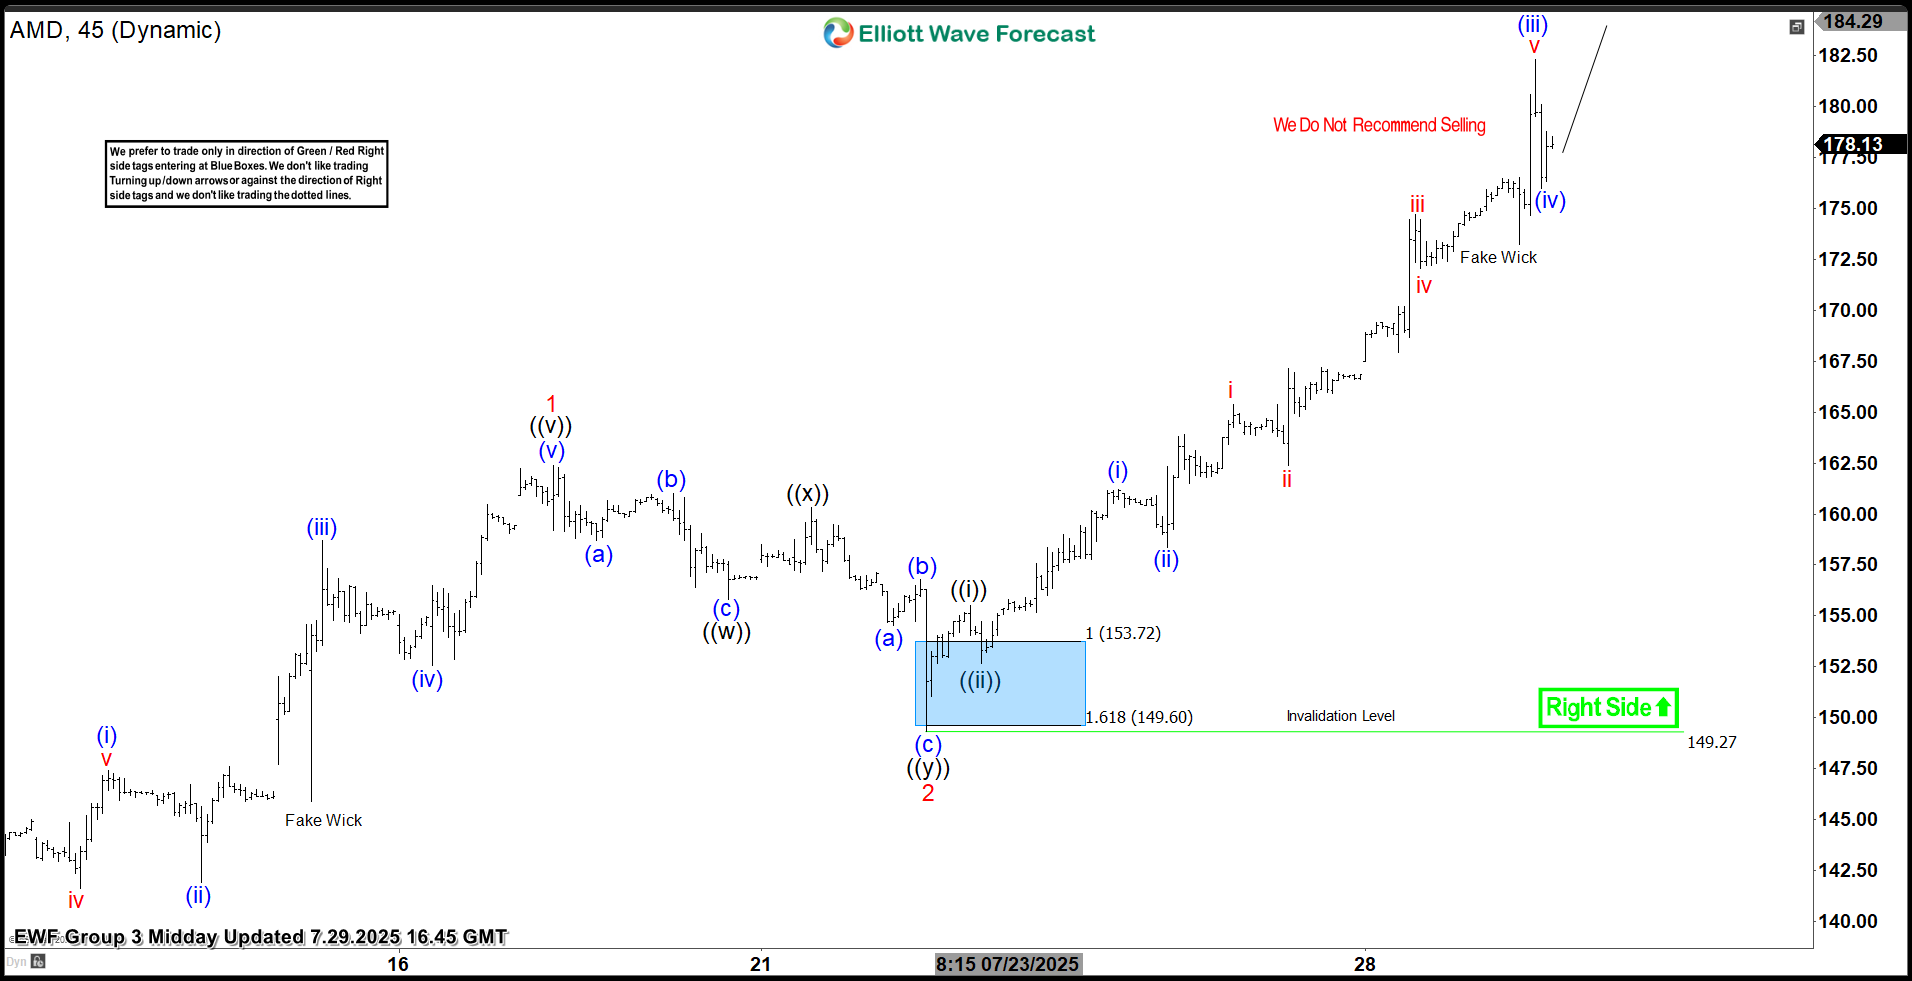
Hello fellow traders. In this technical article, we are going to present Elliott Wave trading setup of AMD. The stock completed its corrective decline precisely at the Equal Legs area, also known as the Blue Box. In the following sections, we’ll break down the Elliott Wave structure in detail and explain the setup and trade management.
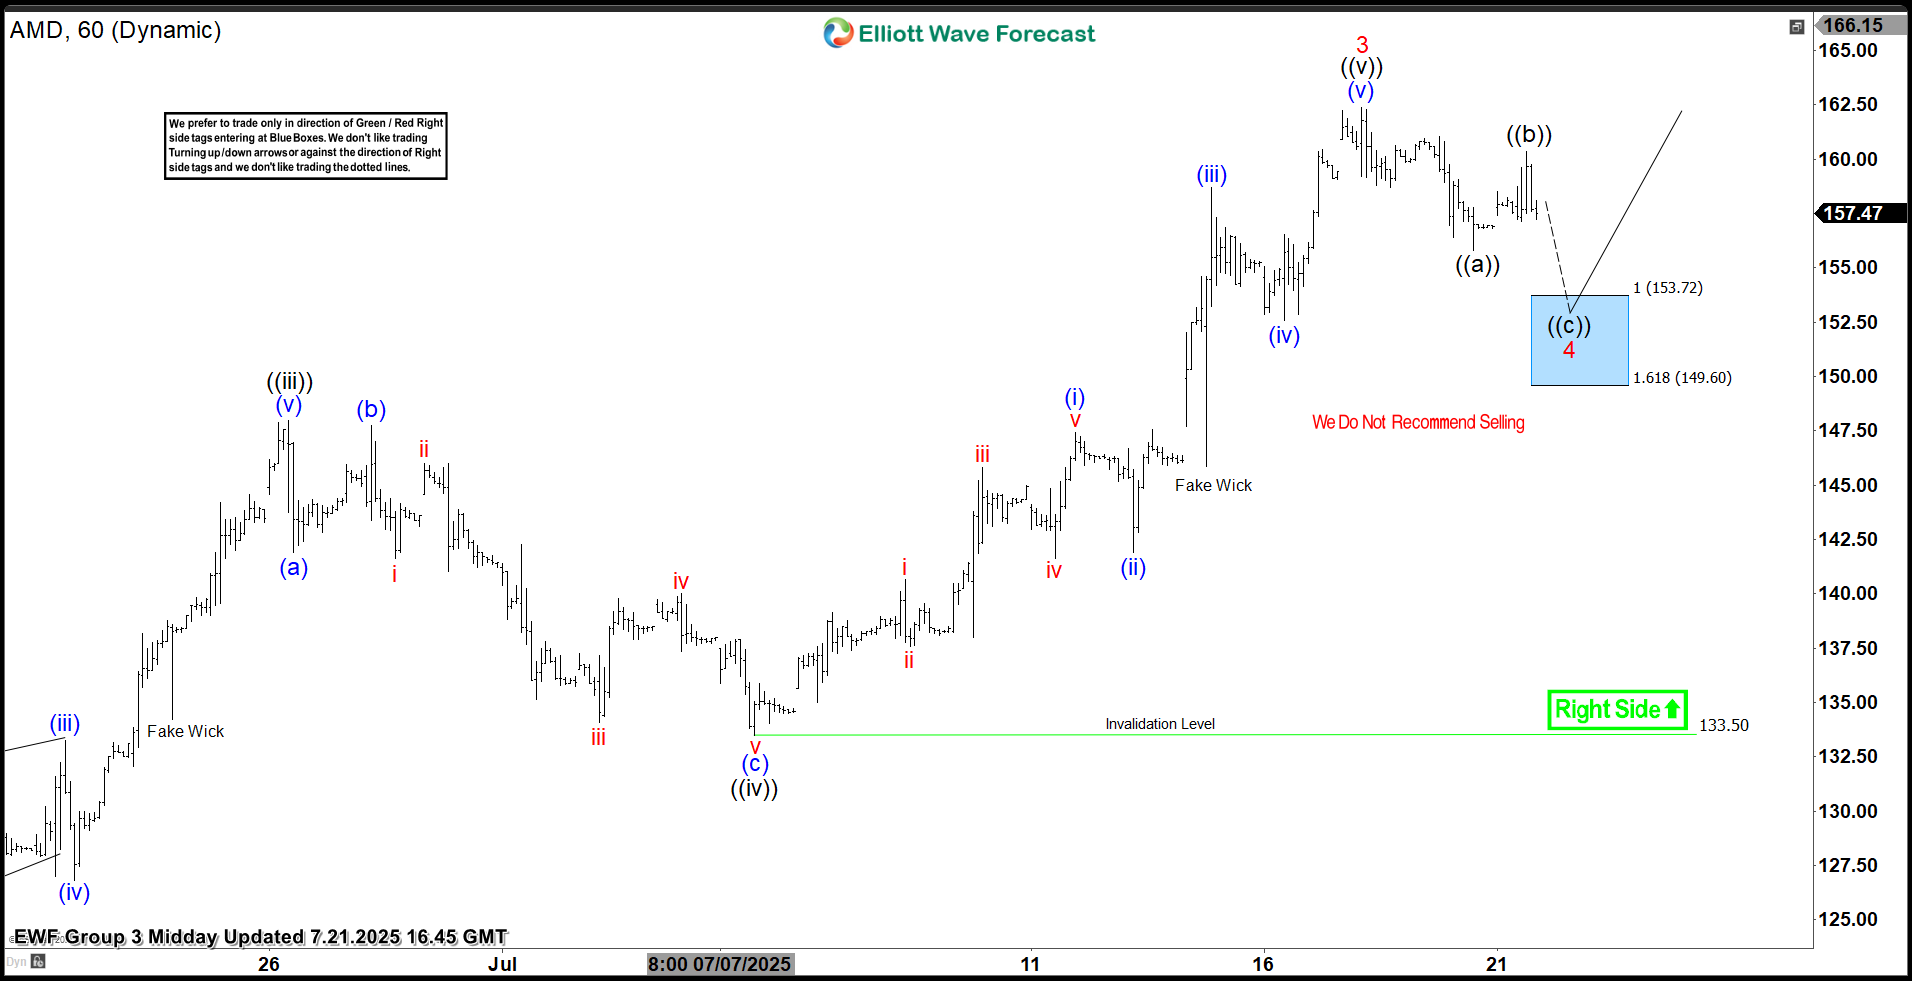
AMD Elliott Wave 1 Hour Chart 07.21.2025
The current analysis suggests that AMD stock is undergoing a wave 4 pull back. We can count 5 waves from the peak so far. That implies the pullback is incomplete at the moment — we expect more short-term weakness, another leg down ((c)) black toward the Blue Box.
Our analysis calls an extension toward the extreme zone at the 153.72-149.60 area, where we are looking to re-enter as buyers. We recommend members avoid selling AMD, as the main trend remains bullish. We anticipate at least a 3-wave bounce from this Blue Box area. Once the price touches the 50% fib level against the ((b)) black connector, we’ll make positions risk-free, set the stop-loss at breakeven, and book partial profits. Stop Loss is placed a few points below 1.618 fib extension.
90% of traders fail because they don’t understand market patterns. Are you in the top 10%? Test yourself with this advanced Elliott Wave Test
Official trading strategy on How to trade 3, 7, or 11 swing and equal leg is explained in details in Educational Video, available for members viewing inside the membership area.
Quick reminder on how to trade our charts :
Red bearish stamp+ blue box = Selling Setup
Green bullish stamp+ blue box = Buying Setup
Charts with Black stamps are not tradable. 🚫
AMD Elliott Wave 1 Hour Chart 07.21.2025
The stock extended lower into the Blue Box area and found buyers, just as expected. AMD stock has staged a strong rally toward new highs . As long as price holds pivot at 149.27 low , further upside remains likely.
Reminder for members: Our chat rooms in the membership area are available 24 hours a day, providing expert insights on market trends and Elliott Wave analysis. Don’t hesitate to reach out with any questions about the market, Elliott Wave patterns, or technical analysis. We’re here to help.