Hello fellow traders! In this technical article, we’ll be discussing GOLD (XAUUSD) and sharing some charts that we’ve presented to the members of ElliottWave-Forecast.
As our members know, GOLD is showing higher high sequences in the cycle from the December 18th low, which suggests a further rally in the commodity. Recently, GOLD completed a 3-wave pullback and made another leg up, reaching our target area. In the following text, we’ll take a closer look at the Elliott Wave count and explain how to find targets for wave (v).
GOLD (XAUUSD) H1 Update 01.23.2025
The commodity is forming a 5-wave pattern in the cycle from the 2656.3 low. We can already count 3 waves down, labeled as abc red. The current view suggests that as long as the price remains above the 2735.8 low, the (iv) blue pullback is considered complete. We believe (v) blue is now in progress, with the first target area projected at 2769.99–2708.55.
Reminder for members: Our chat rooms in the membership area are available 24 hours a day, providing expert insights on market trends and Elliott Wave analysis. Don’t hesitate to reach out with any questions about the market, Elliott Wave patterns, or technical analysis. We’re here to help.
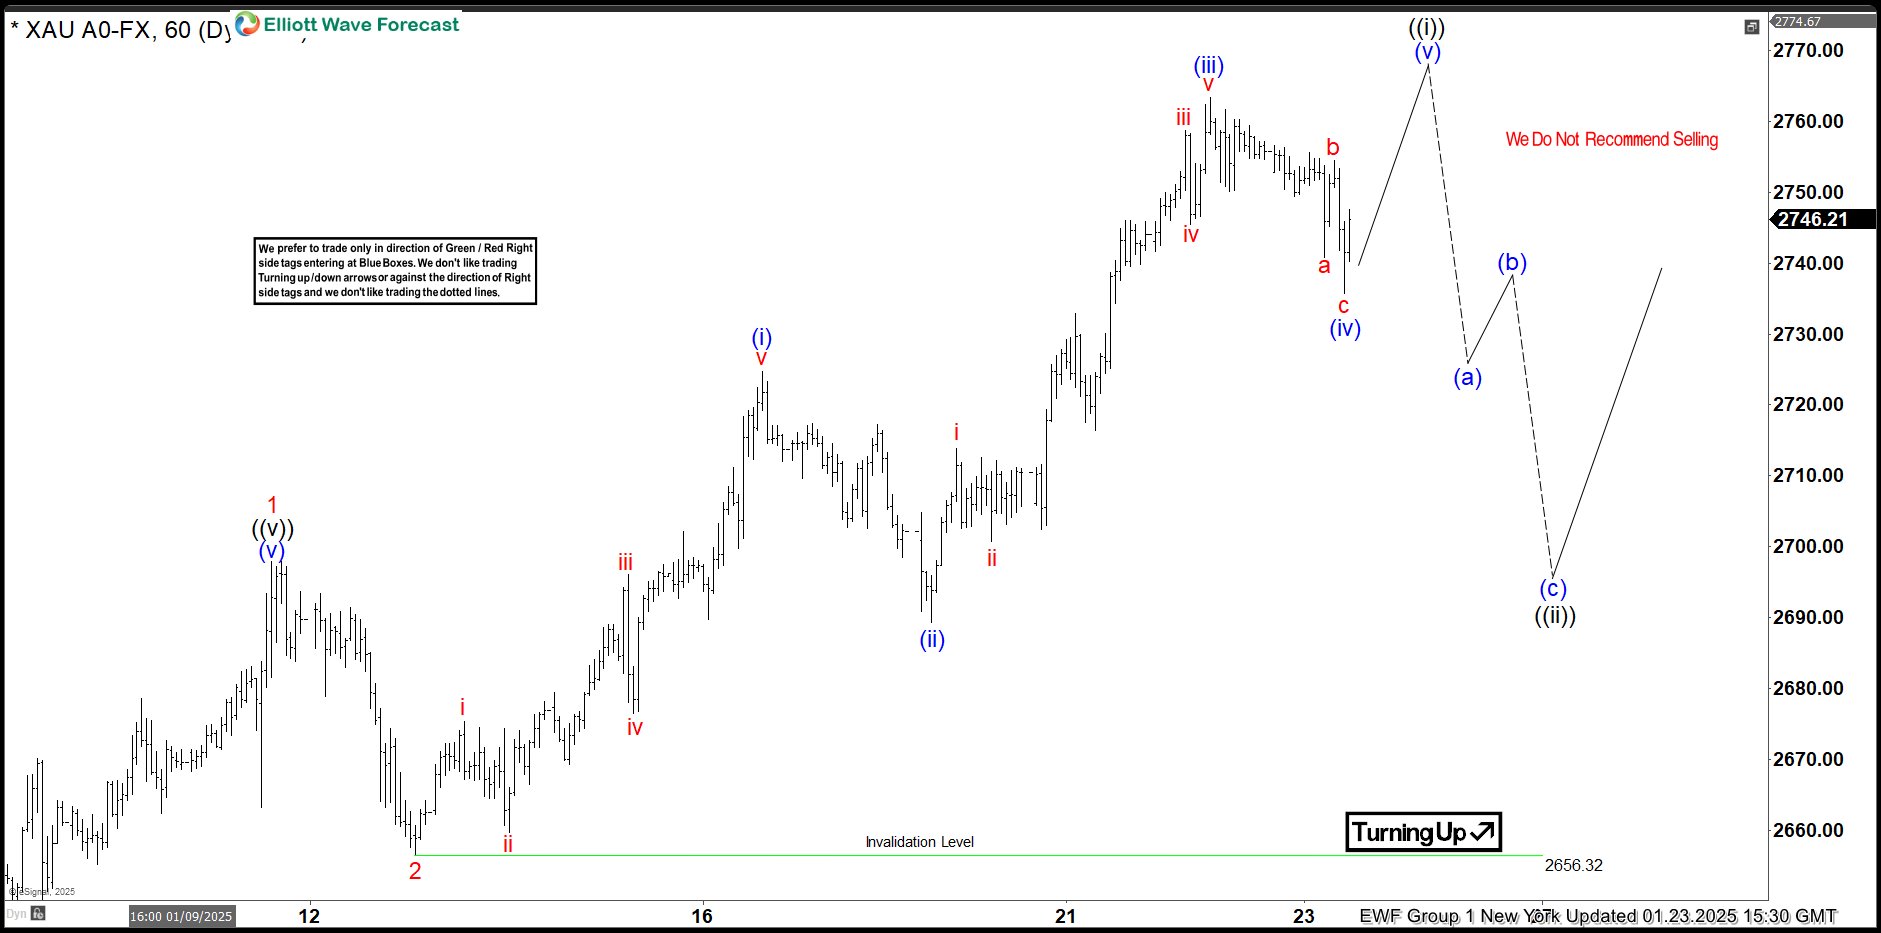
GOLD 1-Hour Chart Showing Wave (iv) Completion
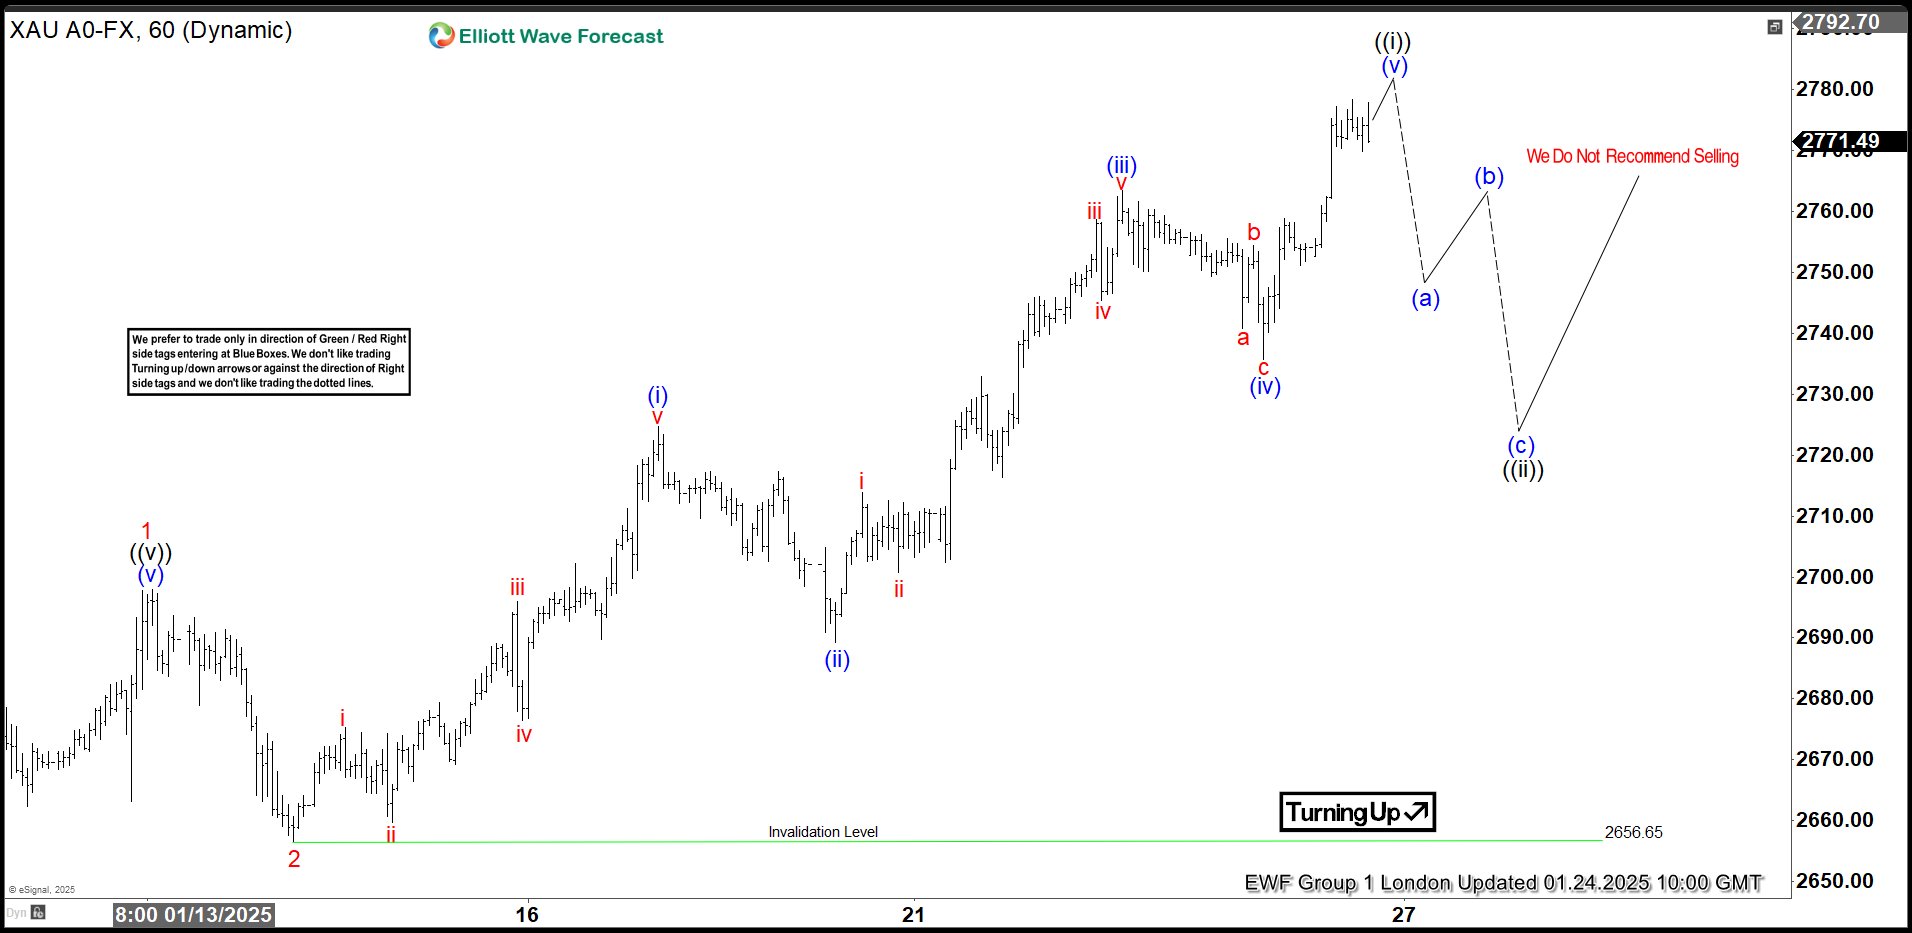
GOLD (XAUUSD) H1 Update 01.24.2025
GOLD continued its rally as expected. Wave (v) reached the first target at 2769.99–2708.55, calculated using the inverse 1.236–1.618 Fibonacci extension of wave (iv). Another method to project the target for wave (v) is (v) = (i), which comes at 2804.4.
Next Expected Moves
We expect the cycle from the 2656.6 low to soon complete as a 5-wave structure ((i) )black and anticipate a pullback in ((ii)). However, we do not recommend selling against the primary bullish trend. Once the ((ii)) pullback begins, we expect it to reach around the 50–61.8 Fibonacci retracement area measured from the 2656.6 low.
Keep in mind market is dynamic and presented view could have changed in the mean time. You can check most recent charts in the membership area of the site. Best instruments to trade are those having incomplete bullish or bearish swings sequences.We put them in Sequence Report and best among them are shown in the Live Trading Room.
90% of traders fail because they don’t understand market patterns. Are you in the top 10%? Test yourself with this advanced Elliott Wave Test