

More than three years ago, we published an article explaining why the 10-year U.S. Treasury yield ($TNX) had started a new bullish market from its March 2020 low. At that time, our Elliott Wave analysis called for yields to continue higher after completing a correction. The market has now provided another major confirmation: $TNX has traded above the October 2023 peak.
This breakout is important because it supports the view that the decline from the historic yield peak into the 2020 low has ended. It also confirms that the advance from March 2020 is not merely a temporary reaction. Based on the Elliott Wave structure, the 10-year yield can continue higher toward 8.21% in the years ahead.
The 2023 Forecast Was Correct https://elliottwave-forecast.com/video-blog/tnx-10-year-treasury-bond-yields/
Our September 2023 article identified two different degrees of trend. The long-term monthly structure was bullish from the March 2020 low, but the shorter weekly cycle was mature. We wrote that the five-wave advance from March 2020 was approaching completion and that a significant three-wave pullback in yields should follow before the larger bullish trend resumed.
That is exactly what happened. $TNX completed wave I near the October 2023 peak and then declined in a corrective A-B-C structure. The weekly chart shows that pullback ending in September 2024 as wave II. The correction reduced yields without damaging the larger bullish sequence from March 2020.
After the September 2024 low, yields turned higher again. The new advance developed impulsively, produced waves 1 and 2 at smaller degree, and has now traded above the October 2023 peak near 5.00%. This breakout validates the central idea from the original article: the anticipated decline was a correction within a new secular bullish market in yields, not the beginning of another multi-decade collapse.
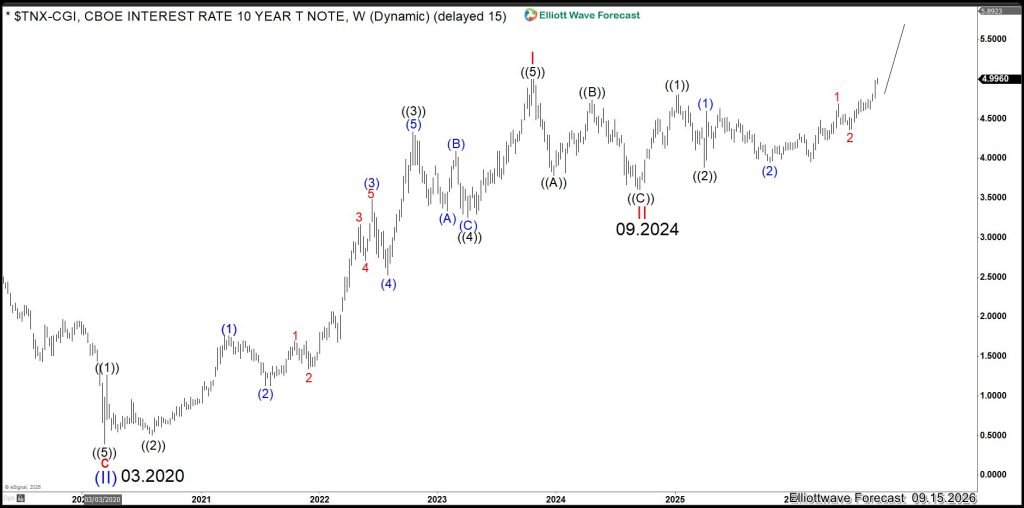
Weekly $TNX Elliott Wave chart. The five-wave rally from March 2020 completed wave I in October 2023. The forecast three-wave pullback ended as wave II in September 2024, and the following impulsive advance has now exceeded the prior peak.
The monthly chart places that successful shorter-term forecast inside the much larger cycle. The decline from the 1981 peak ended in March 2020 as wave (II), completing the long-term correction that began after the late-1970s inflationary era. The current rally is labeled as the opening phase of wave (III). The next major Fibonacci objective appears at 8.2494%, which we treat as an approximate 8.21%-8.25% target area. A higher extension near 11.12% can become relevant later, but it is not the primary objective of the present article.
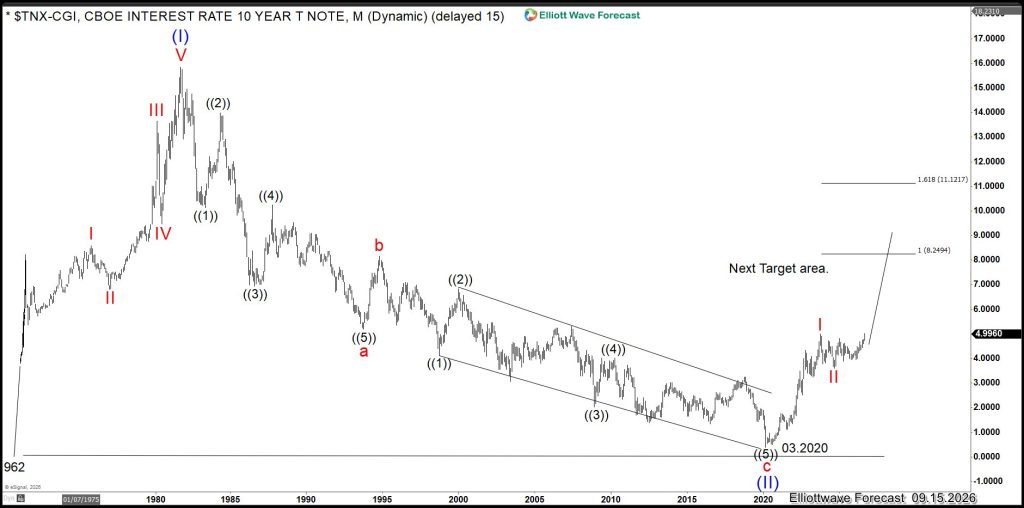
Monthly $TNX Elliott Wave chart. The multi-decade correction ended in March 2020, and the bullish sequence now projects toward the 8.21%-8.25% target area.
The Long-Term Cycle in Treasury Yields
The secular rise in U.S. Treasury yields reached its mature stage around the 1981 peak. From there, $TNX declined for almost four decades before recording its historic low in March 2020. In Elliott Wave terms, the decline unfolded as a large corrective sequence and completed the cycle that began in the late 1970s.
The March 2020 low therefore represents more than the bottom of a normal interest-rate cycle. It can mark the end of an entire era of declining yields and increasingly inexpensive credit.
From that low, $TNX advanced impulsively into October 2023. That rally established the first major leg of the new bullish sequence. After a corrective period, the break above the October 2023 peak confirms that the larger advance has resumed. As long as the important Elliott Wave pivot shown on the chart remains intact, pullbacks should continue to find buyers in 3, 7, or 11 swings, creating the path toward the 8.21% target.
It is important to distinguish the yield from the underlying Treasury security. $TNX tracks the 10-year Treasury yield. Therefore, a bullish move in $TNX means rising yields and generally falling prices for existing 10-year Treasury notes.
Why Can the 10-Year Yield Continue Higher?
The Elliott Wave structure gives us the projected market path, while the fundamental environment can help explain the forces accompanying it.
Persistent inflation risk
Investors buying a 10-year Treasury commit capital for a long period. If they expect inflation to remain above the levels seen during the pre-2020 era, they will normally demand more yield to compensate for the loss of purchasing power. Even when inflation moderates temporarily, uncertainty about its long-term path can keep a premium embedded in longer-term rates.
Large government borrowing requirements
The U.S. Treasury must regularly issue securities to fund budget deficits and refinance maturing debt. When the supply of debt increases, the market may require higher yields to attract enough buyers—especially if demand does not rise at the same pace.
A higher term premium
Long-term yields reflect more than expectations for the Federal Reserve’s overnight policy rate. Investors also require compensation for holding long-duration securities whose prices can fluctuate substantially. Inflation uncertainty, fiscal risk, and heavy Treasury issuance can all raise this term premium.
The Federal Reserve does not fully control the 10-year yield
The Federal Reserve directly influences short-term interest rates, but the 10-year yield is set by the bond market. It incorporates expectations for future growth, inflation, monetary policy, and the compensation demanded for long-term risk. Consequently, the Federal Reserve can cut short-term rates while the 10-year yield remains elevated—or even continues higher—if the market is concerned about inflation, debt supply, or fiscal credibility.
What Would an 8.21% 10-Year Yield Mean?
A move toward 8.21% would represent a major repricing of money across the global financial system. The 10-year Treasury yield is a benchmark used directly or indirectly in the valuation of mortgages, corporate debt, commercial real estate, equities, currencies, and many other assets.
Housing affordability would face additional pressure
Mortgage rates generally follow the direction of the 10-year Treasury yield, although the spread between the two can expand or contract. Sustained movement toward 8.21% would likely keep mortgage rates exceptionally high. Monthly payments would rise for new buyers, affordability would fall, refinancing activity would remain limited, and transaction volume could stay under pressure. Home prices would not necessarily collapse because housing supply also matters, but the cost of financing would become a much larger obstacle.
Corporations would refinance at higher rates
Companies that issued inexpensive debt during the low-rate era eventually need to refinance it. Higher Treasury yields raise the risk-free base rate used to price corporate borrowing. Businesses with weak balance sheets would face the greatest pressure, while highly leveraged sectors and commercial real estate could experience more defaults, restructurings, or reduced investment.
Federal interest expense would continue rising
Higher yields do not affect the entire federal debt stock immediately because existing securities mature over time. However, as old debt is refinanced and new deficits are funded at higher rates, the government’s average interest cost rises. That can consume a larger share of federal revenue and create harder choices involving taxes, spending, and additional borrowing.
Equity valuations would become more selective
Treasury yields are central to the discount rates used to value future corporate cash flows. Higher discount rates can compress valuation multiples, particularly for long-duration growth companies whose expected profits lie far in the future. This does not mean every rise in yields must produce a stock-market decline: strong economic growth can lift both earnings and yields. However, a persistent move toward 8.21% would raise the hurdle rate for all risk assets and reward companies with strong current cash flow, pricing power, and manageable debt.
The U.S. dollar and Japanese yen would remain important correlations
Higher U.S. yields can support the dollar when they widen the interest-rate advantage over other countries. This has been especially important for USDJPY, since wide U.S.–Japan yield differentials have historically encouraged yen-funded carry trades. However, currency markets respond to relative—not absolute—rates. The effect would depend on the policies of the Federal Reserve, the Bank of Japan, and other central banks, as well as global risk sentiment.
Financial stability risks would increase
When yields rise, the market value of existing fixed-rate bonds falls. A rapid move can create unrealized losses for banks, funds, insurers, and other institutions holding long-duration assets. The greatest risk appears when those assets must be sold to meet withdrawals or margin requirements. An orderly rise can be absorbed; a disorderly move is more likely to expose leverage and liquidity mismatches.
Elliott Wave Structure Remains the Primary Guide
Fundamentals can be interpreted in many ways, and markets often begin moving before a fundamental narrative becomes obvious. That is why we use Elliott Wave Theory, sequences, cycles, and correlations to define the preferred path.
The break above the October 2023 peak is a decisive structural development. It confirms the bullish sequence from the March 2020 low and opens the next long-term objective at 8.21%. The advance will not occur in a straight line. Significant pullbacks in yields—and rallies in Treasury prices—will develop along the way. However, while the key Elliott Wave pivot remains intact, those corrections should form part of the larger bullish cycle in $TNX.
The consequences extend far beyond the bond market. If the projection unfolds, the world will need to adjust to structurally higher borrowing costs, tighter valuation standards, greater fiscal pressure, and a financial environment very different from the one that prevailed between 1981 and 2020.
The chart will show the path. Price structure will confirm it.


