

PM is correcting the bullish cycle from November 2025 low. The stock could find buyers from the blue box. This blog post identifies the blue box zone to trade from.
Philip Morris International Inc. (PM) is a leading global tobacco and nicotine company headquartered in Stamford, Connecticut. It manufactures and markets well-known cigarette brands, including Marlboro, and is actively transitioning toward smoke-free products through its “Beyond Nicotine” strategy. PMI’s flagship smoke-free product, IQOS, uses heat-not-burn technology and has gained significant global adoption. Operating in over 180 markets, the company focuses on reducing the health impact of smoking by investing heavily in science-based alternatives and next-generation nicotine delivery systems.
From the all-time low of $32 in March 2009, PM’s stock price has surged over 475%, peaking at $186 in June. Since then, it has completed a 3-swing structure. While we anticipate at least a 5-swing chart evolution, the 3rd swing appears incomplete. We’ve identified the first swing, ending at the June 2017 peak, as wave (I). A pullback followed, correcting it in wave (II), which ended at the March 2020 low. From there, wave (III) began. Wave (III) could target $204, 1.618 of (I) from (II), and potentially even higher.
Meanwhile, waves I and II of (III) started and ended at the February 2022 high and September 2022 low, respectively. From September 2022, a strong wave III of (III) emerged, completing at the June 2025 peak, the previous all-time peak. The pullback from this peak was evolving as wave IV when we shared the chart below on Oct0ber 29, 2025’s blogpost.
PM Elliott Wave Analysis – October 29, 2026 Weekly Chart

Wave IV pullback completed a double zigzag structure at the extreme where we recommended readers to go long at 144.1, stop at 124.79 and target at 200. What has happened barely a year after?
PM Elliott Wave Analysis – 6th September 2026 Weekly Chart
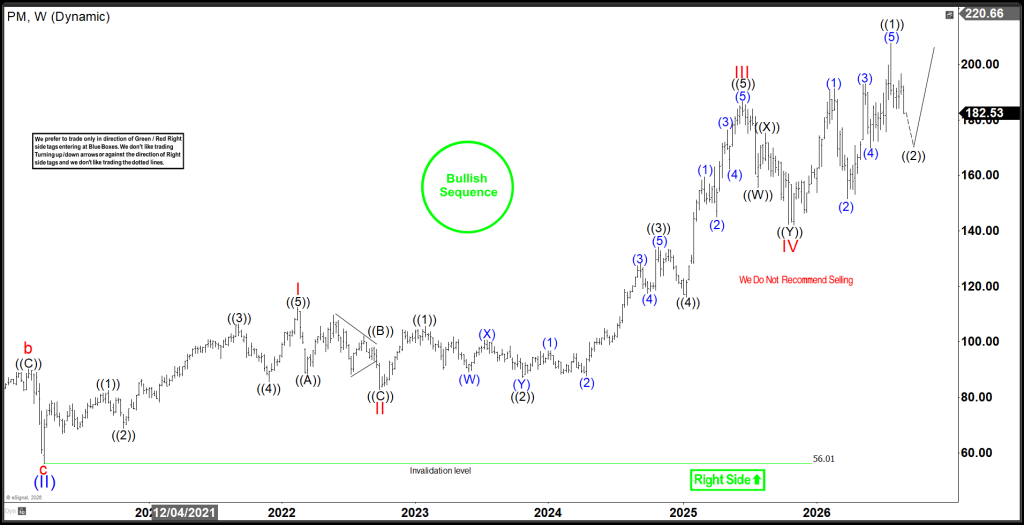
The latest weekly chart below shows how wave V evolved from the low of November 2025. Price rallied as expected to complete a diagonal structure. Either the diagonal completed as wave ((1)) of V of III or V of (III).I will go with the former because I expected a much more extended wave (III). Thus, the current pullback is most likely wave ((2)) of V of (III). Traders can wait to buy the dips again, at the extreme of 3,7 or 11 swing structure.
PM Elliott Wave Analysis – 6th September 2026 Daily Chart
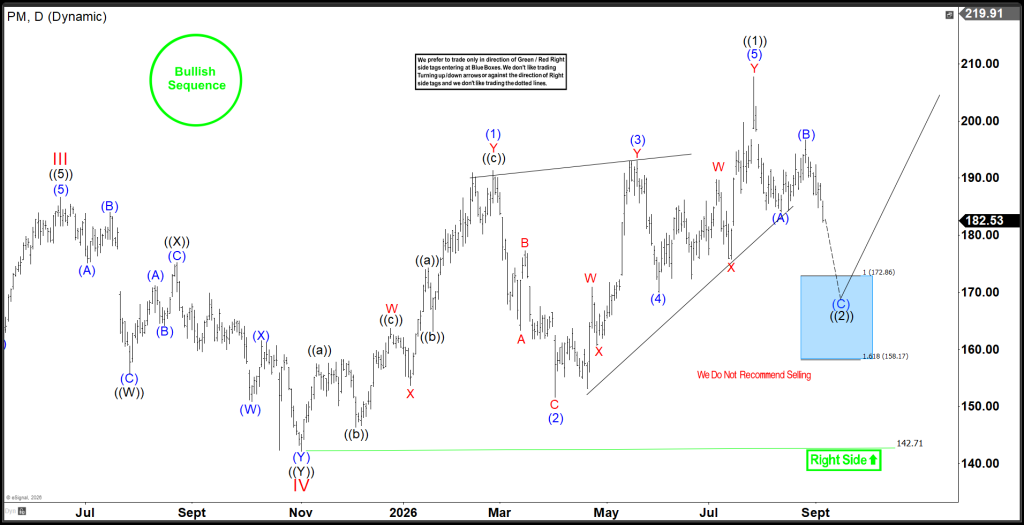
As the daily chart above shows, the wave ((2)) pullback started at the late July high. Price is currently in wave (C) of ((2)). We have identified the 172.86-158.17 extreme zone. At the zone, traders can expect at least a 3-swing bounce. Ideally, wave ((2)) could emerge from there, leading to a fresh record high.
About Elliott Wave Forecast
At www.elliottwave-forecast.com, we update one-hour charts four times daily and four-hour charts once daily for all 78 instruments. We also conduct daily live sessions to guide clients on the right side of the market. Additionally, we have a chat room where moderators answer market-related questions. Experience our service with a 14-day trial for only $0.99. Cancel anytime.


