

Tesla has spent the last several years moving through what, on the surface, can look like a frustrating period of volatility and consolidation. From an Elliott Wave perspective, however, that volatility may be serving a much more important purpose: building a series of nested first and second waves that can eventually produce a powerful third-wave acceleration.
Our long-term view on $TSLA remains constructive. The weekly structure suggests that the major advance from the 2023 low is not necessarily the end of the bullish sequence. Instead, we believe Tesla may be developing a nest inside a larger bullish cycle, and that structure can ultimately open the door to the $937 area within the next five years.
The important point is that $937 should not be viewed as a conventional fundamental price target. It is a long-term Elliott Wave projection derived from the relationship between the major wave I and wave II structure and the potential acceleration that follows when a third wave begins extending at multiple degrees.
The Fundamental Story Still Matters
Elliott Wave analysis focuses on market structure rather than attempting to forecast price from earnings multiples alone. However, major multiyear advances normally need a fundamental narrative capable of supporting sustained investor participation.
Tesla has several potential drivers that can provide that backdrop.
The company is no longer simply an electric-vehicle manufacturer. The long-term Tesla investment thesis increasingly revolves around a combination of electric vehicles, energy storage, artificial intelligence, autonomous driving, software, manufacturing scale and robotics.
The automotive business remains the foundation of the company, but over the next several years the market may increasingly judge Tesla by how effectively it can monetize businesses beyond the traditional sale of vehicles.
Energy storage is particularly important because it broadens Tesla’s exposure to the global electrification cycle. Increased electricity demand from data centers, AI infrastructure, renewable generation and grid modernization creates a potentially large addressable market for battery-storage solutions.
Autonomy represents another potential source of operating leverage. If Tesla succeeds in materially expanding autonomous-driving capabilities and creating a scalable software or mobility business around that technology, the market could eventually assign substantially greater value to each vehicle produced.
Then there is robotics. Tesla’s Optimus project remains far less mature than the automotive business, but it represents the type of optionality that can become meaningful during a long-duration technology cycle. Artificial intelligence, autonomous machines and increasingly automated manufacturing could eventually become important components of Tesla’s valuation.
None of these developments is guaranteed. Tesla still faces substantial risks including competition, execution, vehicle pricing, margins, capital requirements, regulation and the uncertainty surrounding the commercialization of autonomy and robotics.
That uncertainty is precisely why we do not base the $937 outlook solely on fundamental assumptions.
The price structure must confirm the story.
The Major Wave I and Wave II Foundation
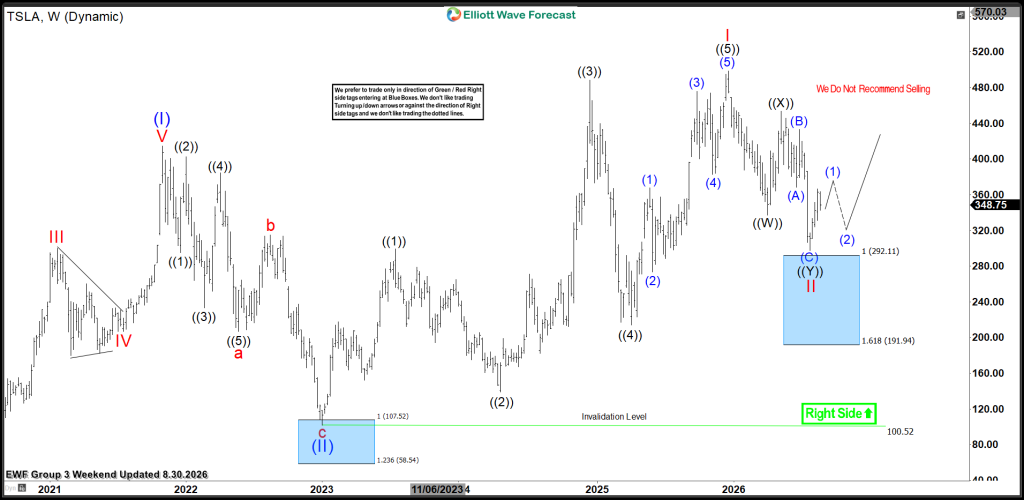
The weekly Elliott Wave chart gives us the larger framework.
Tesla completed a major wave I advance into the 2021 peak. That move represented the first major impulsive cycle at the degree we are tracking.
What followed was equally important.
The decline into the 2023 area is labeled wave II.
This is the foundation of the long-term bullish thesis.
Wave II corrections frequently retrace a significant portion of wave I. They can be deep, emotional and long enough to convince market participants that the previous bullish cycle is finished.
But when the wave II low remains intact, Elliott Wave theory anticipates another impulsive sequence.
And that next sequence is wave III.
The weekly chart identifies the key long-term invalidation level near $100.52. As long as the larger structure remains above the relevant wave II low, the possibility of another major bullish cycle remains alive.
This is where the path toward $937 begins.
The $937 objective is derived from the larger wave I–wave II relationship. In Elliott Wave methodology, once a first wave and its second-wave correction are established, Fibonacci extensions of that initial impulse can be projected from the wave II low to identify potential objectives for the developing third wave.
Therefore, $937 is not an arbitrary number.
It represents a structural objective associated with the next major impulsive phase following the completion of waves I and II.
Why Nesting Changes the Character of the Forecast
The second illustration explains the most important concept behind our Tesla outlook.
A market does not always move directly from wave II into an immediately vertical wave III.
Sometimes it creates another 1–2 sequence inside the larger wave III.
Then another.
This is called nesting.
Conceptually, the sequence develops like this:
I → II → (1) → (2) → 1 → 2 → acceleration through successive third waves
Every new first wave represents another impulsive move.
Every second wave represents a correction that preserves the bullish structure.
When several of these formations occur at different degrees, the market effectively creates a third wave inside a third wave, which itself may be developing inside an even larger third wave.
That is the significance of the illustration showing a third-wave extension of a third-wave extension.
The real importance of a nest is not simply that price remains bullish.
It is that the structure can eventually produce nonlinear acceleration.
Instead of one degree of trend pushing higher, several degrees of trend can begin pointing in the same direction simultaneously.
That is when price behavior can change dramatically.
Applying the Nesting Concept to Tesla
Tesla’s weekly structure has already produced multiple impulsive advances and corrective sequences following the major wave II low.
The current chart shows another important corrective region between approximately $292.11 and $191.94. This is the Blue Box area on the chart.
The Elliott Wave Forecast methodology does not require Tesla to reach the bottom of that zone. Rather, the area represents the region where a corrective sequence could potentially complete while preserving the larger bullish structure.
The chart therefore continues to display the Right Side higher.
More importantly, the projected path shows an initial advance labeled wave (1), followed by a corrective wave (2), before the next larger advance develops.
That potential 1–2 sequence is important.
If Tesla forms another bullish first and second wave while the larger-degree bullish structure remains intact, it creates another nest.
The sequence would then contain bullish impulses at several degrees.
That is exactly the type of configuration capable of producing a powerful third-wave extension.
Instead of thinking about Tesla simply moving from approximately $350 to $400, the more important question becomes:
What happens if the next rally is wave 3 of a larger wave (3), developing within an even larger wave III?
That is where the long-term upside potential becomes considerably more significant.
Why $937 Becomes Technically Possible
The road to $937 does not require Tesla to move vertically from current levels.
In fact, Elliott Wave theory would expect corrections along the way.
There will be wave 2 pullbacks.
There will be wave 4 corrections.
There may be extended consolidations and periods when the bullish thesis is questioned again.
But if the larger wave I and II sequence remains intact and additional 1–2 formations continue developing above the major invalidation level, those corrections can actually strengthen the nesting interpretation rather than invalidate it.
The objective is therefore not based on predicting every intermediate Tesla movement.
It comes from understanding the degree of the cycle.
A major wave I has already established the initial impulse.
A major wave II established the corrective base.
The next important phase should be wave III.
If wave III begins extending internally—and particularly if Tesla develops a third wave of a third wave extension—the market can eventually travel much farther than conventional linear projections would suggest.
Under that scenario, the $937 region becomes a realistic long-term Elliott Wave objective during the next five years.
It should be understood as a structural target rather than a promise about either price or timing.
Copper and the Dow Jones Are Showing Why Nests Matter
Tesla is not the only market where this concept is important.
We recently discussed a similar structural phenomenon involving Copper ($HG) and Dow Jones Futures ($YM).
The significance is not that Tesla, Copper and the Dow Jones are identical markets. They obviously are not.
The importance is that Elliott Wave structures can reveal the same underlying behavior across apparently unrelated instruments.
In Copper and the Dow, overlapping bullish structures can reveal a developing nest and raise the possibility of a much larger risk-on acceleration when the nested third waves begin unfolding.
That analysis is especially relevant to Tesla because a broad risk-on environment can provide an important macro backdrop for high-beta growth assets.
You can read the full analysis here:
Dow Jones and Copper: Why the Overlap Reveals a Nest and Signals a Major Risk-On Acceleration
Dow Jones and Copper: Why the Overlap Reveals a Nest and Signals a Major Risk-On Acceleration
The relationship between $HG and $YM illustrates an important principle: when several markets begin displaying nested bullish structures simultaneously, the message can be bigger than any individual chart.
It can indicate that the broader market cycle itself is preparing for another period of acceleration.
Tesla could participate strongly if that environment develops.
Fundamentals Can Become the Catalyst, but Structure Comes First
Investors naturally want to know what fundamental event could push Tesla toward dramatically higher prices.
It could be stronger energy-storage growth.
It could be a meaningful breakthrough in autonomous driving.
It could be commercialization of robotaxis.
It could be improvements in manufacturing economics.
It could be robotics.
It could be something the market is not fully pricing today.
But Elliott Wave analysis approaches the problem differently.
We do not need to know the precise headline in advance.
We need to understand the structure before the headline arrives.
Markets frequently begin positioning before the fundamental explanation becomes obvious.
That is one reason a nesting structure is so valuable. It can reveal increasing bullish pressure while price still appears to be consolidating.
The fundamentals can eventually become the catalyst that the financial media uses to explain the acceleration.
The Elliott Wave structure may identify the possibility of that acceleration considerably earlier.
Conclusion: Tesla’s Next Five Years May Be About the Nest
Tesla remains one of the most debated companies in the global market, and there will continue to be strong arguments on both sides of its valuation.
Our approach is different.
We focus first on the structure.
The major wave I advance followed by wave II provides the foundation of the long-term bullish cycle. The subsequent subdivisions suggest that Tesla can be developing additional first- and second-wave sequences inside that larger structure.
That is the definition of a nest.
And when those nested sequences begin resolving into their respective third waves, markets can experience the type of acceleration illustrated by a third-wave extension of a third-wave extension.
As long as the larger bullish structure remains valid, our long-term roadmap continues to allow Tesla to reach approximately $937 within the next five years.
The move will almost certainly not occur in a straight line. There will be corrections, volatility and periods when the market challenges the bullish interpretation.
But the important question is not whether every correction can be avoided.
It is whether those corrections continue to form above the major structural lows while creating additional bullish nests.
If they do, the next chapter for $TSLA may ultimately be much larger than the market currently expects.




