

The semiconductor sector (SMH) remains supported by strong AI infrastructure spending over the next three months. Nvidia recently projected roughly 70% revenue growth for its next fiscal year. Meanwhile, hyperscaler AI spending continues at extraordinary levels, supporting demand for GPUs, memory, networking, and semiconductor equipment. This matters greatly for SMH because Nvidia represents about 23% of the ETF. TSMC, Broadcom, AMD, Micron, and ASML also carry significant weights. Therefore, strong earnings and sustained AI capital spending could limit the depth of the current correction.
However, several fundamental risks could support the deeper wave ((II)) scenario toward the 431.39–327.14 blue box. First, semiconductor valuations already reflect very strong growth expectations, leaving little room for earnings disappointments. Recent AMD and Marvell reactions showed how quickly investors can punish results that fail to exceed expectations. Additionally, persistent inflation could force the Federal Reserve to raise rates, increasing pressure on high-growth technology valuations. Further U.S.-China restrictions could also disrupt semiconductor sales and equipment demand. Finally, slower AI spending, margin pressure, or weaker guidance from major SMH holdings could accelerate the correction. If several risks emerge together, fundamentals will increasingly support the deeper wave ((II)) decline shown on the chart.
Elliott Wave Outlook: SMH Daily Chart June 13th, 2026
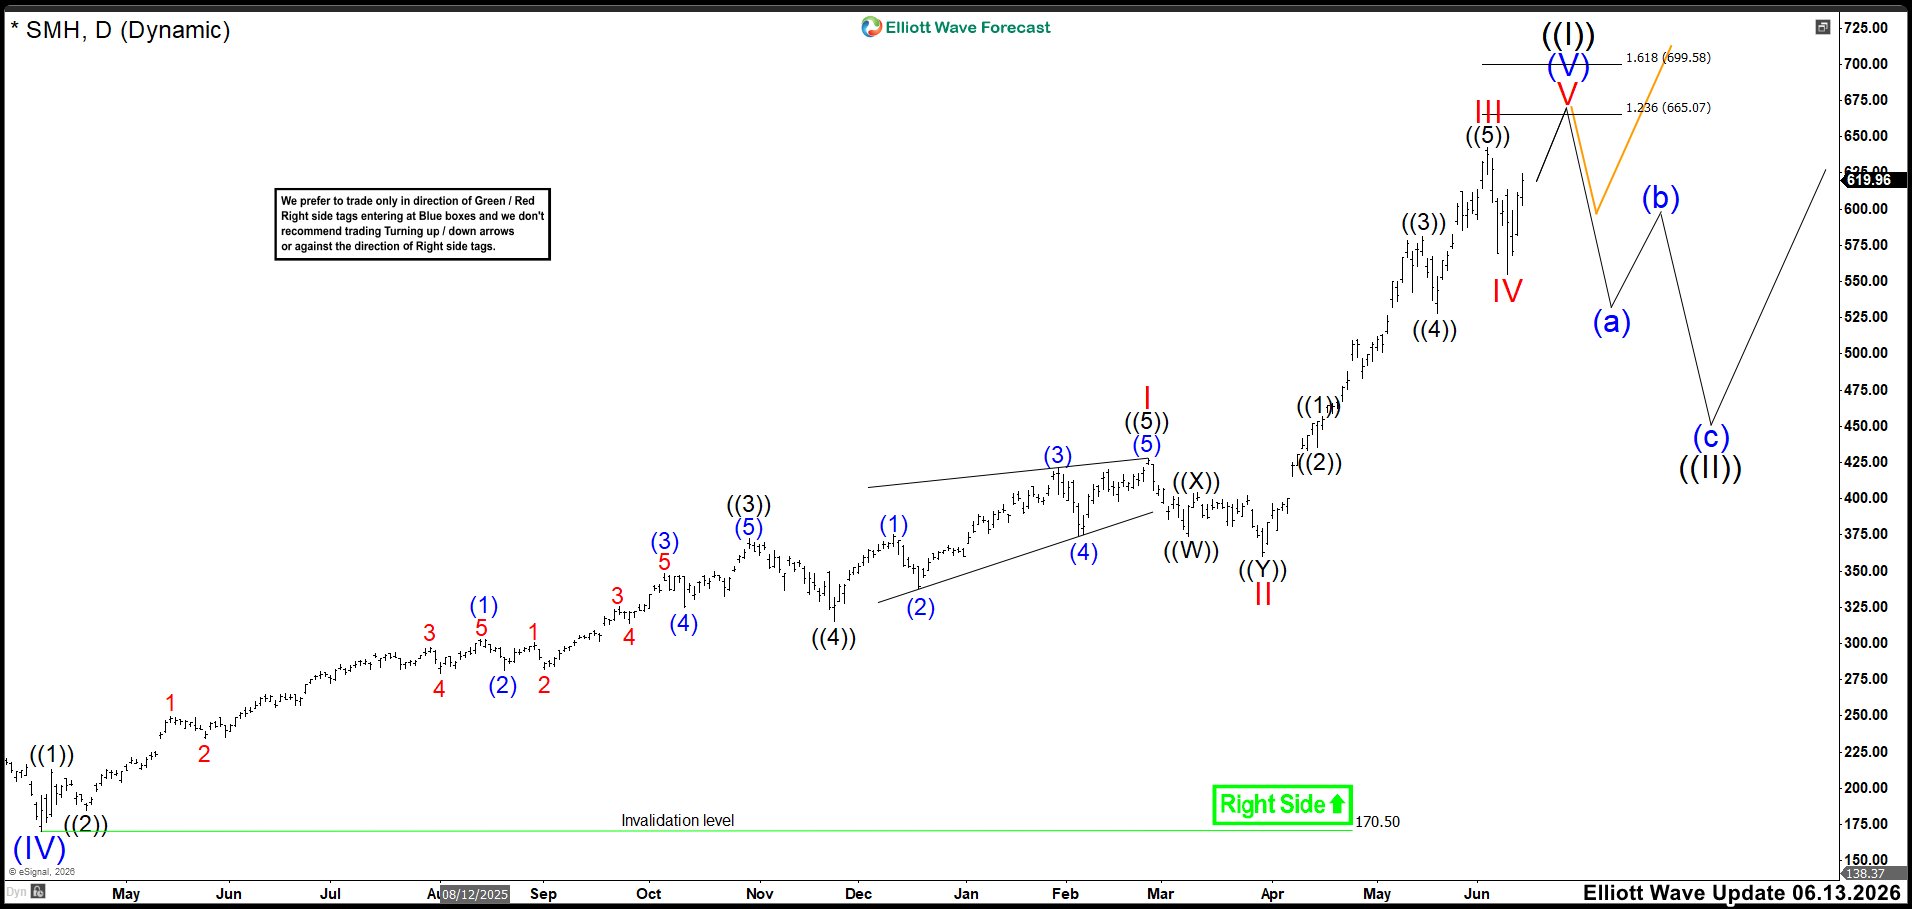
Back in June, we were expecting SMH to continue advancing from the wave (IV) low within wave (V). We viewed that move as the final leg of the larger impulse, which usually shows slower acceleration and signs of exhaustion. At that time, the internal structure suggested a mature fifth wave. Therefore, we were looking for the cycle to complete within the 665–700 area, where the Fibonacci extensions and the final impulse projections converged.
Once wave (V) completed inside that zone, we expected the market to enter a decisive corrective phase with two possible paths. The first was the deeper scenario, shown by the black path, where SMH would develop a higher-degree wave ((II)) and correct the entire cycle from the 2022 lows. That outcome implied a stronger and more prolonged decline. The second was the orange path, where the market would only correct the cycle that started on June 9. In that case, we expected a more moderate pullback in three or seven swings before the bullish trend resumed. The key level separating both scenarios was the wave IV low. A break below that level would confirm the deeper wave ((II)) correction. As long as it held, we continued to favor the more moderate corrective scenario.
Elliott Wave Principle Behind the Market Structure
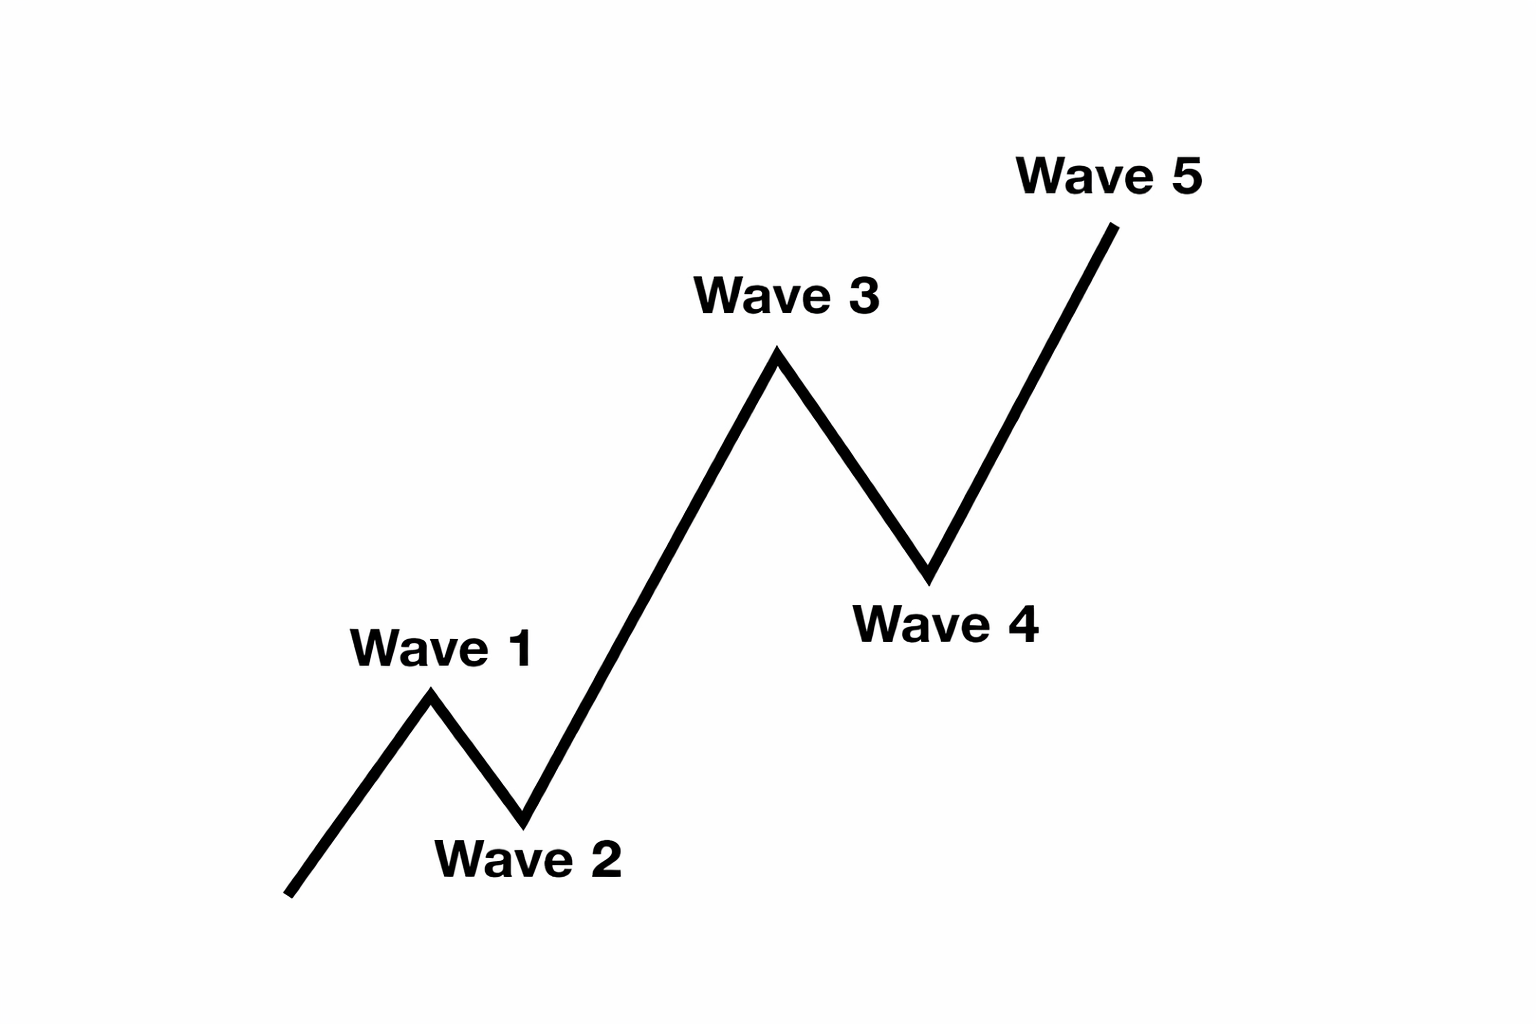
Impulse
An impulse is a clean 5‑wave pattern that drives the trend forward.
- Waves 1‑3‑5 are strong and directional.
- No overlap between waves 1 and 4.
- Wave 3 is usually the strongest.
- Structure is clear, with increasing momentum.
Wave Extensions
Extensions occur when one impulsive wave becomes significantly longer and more powerful than the others.
Most commonly, wave 3 extends, creating the longest and most explosive leg.
An extended wave subdivides into a clear, elongated 5‑wave pattern.
The other two impulsive waves remain shorter and more proportional.
Extensions highlight where the market’s strongest momentum is concentrated. 
Elliott Wave Outlook: SMH Daily Chart August 28th, 2026
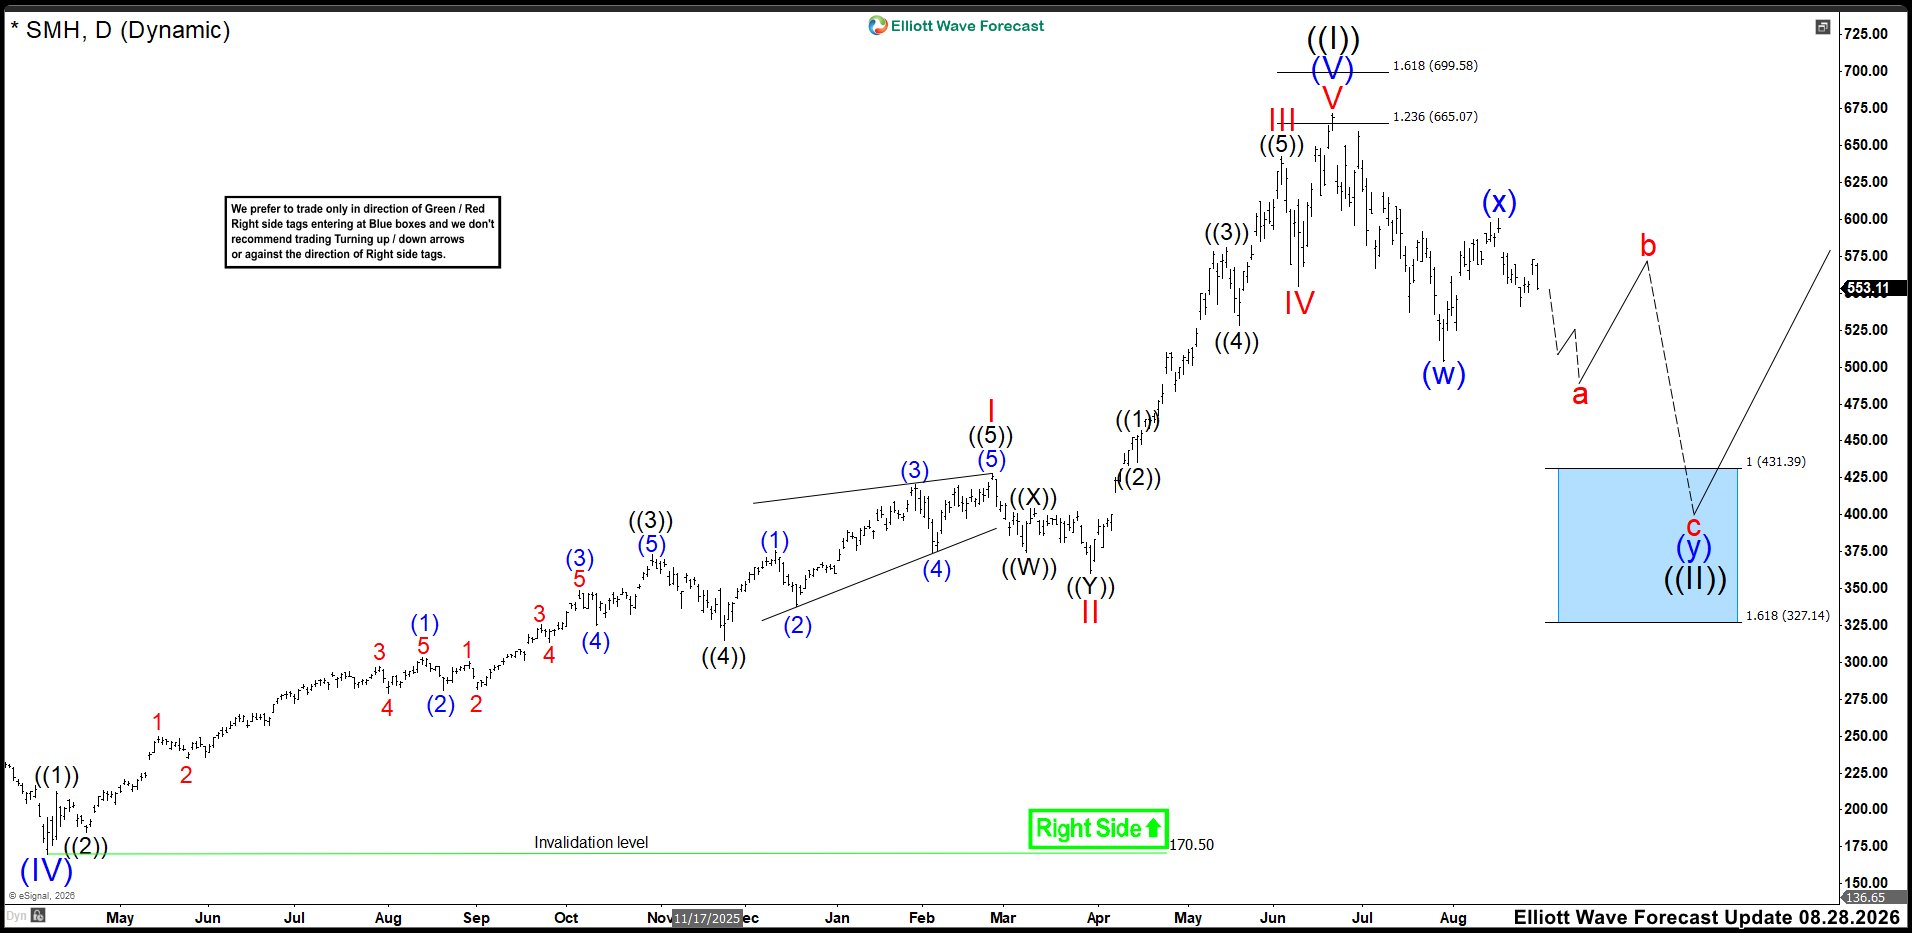
SMH completed a strong impulsive advance from the 2025 low into wave ((I)). The rally also completed within the target area we were looking for. Since then, price has entered a larger corrective phase. The current structure favors a (w)-(x)-(y) double correction.
Wave (w) completed the first decline, while wave (x) produced the corrective rebound. We cannot fully confirm that wave (x) has ended yet. However, the rebound looks sufficient to label the connector complete for now. Therefore, we expect wave (y) to develop lower through an a-b-c structure.
The next key confirmation will come from a break below the wave (w) low. That break would strengthen the bearish sequence and increase the probability of reaching the 431.39–327.14 blue box. We expect wave c of (y) to complete the larger correction inside that area.
However, a break above wave ((I)) would invalidate the projected decline. That move would suggest wave ((II)) already ended at the wave (w) low. Until then, the preferred path remains lower toward the blue box.
The long-term outlook remains bullish while price stays above 170.50. We expect buyers to appear inside the blue box and resume the larger bullish trend.
Transform Your Trading with Elliott Wave Forecast!
Ready to take control of your trading journey? At Elliott Wave Forecast, we provide the tools you need to stay ahead in the market:
Blue Boxes: Stay ahead in the market with fresh 1-hour charts updated four times daily, daily 4-hour charts on 78 instruments, and precise Blue Box zones that highlight high-probability trade setups based on sequences and cycles.
Live Sessions: Join our daily live discussions and stay on the right side of the market.
Real-Time Guidance: Get your questions answered in our interactive chat room with expert moderators.
🔥 Special Offer: Start your journey with a 14-day trial for only $0.99. Gain access to exclusive forecasts and Blue Box trade setups. No risks, cancel anytime by reaching out to us at support@elliottwave-forecast.com.
💡 Don’t wait and get a DISCOUNT for any plan!
Click in the next link, go to Home Chat and ask for a flat discount code saying that you saw this in Luis’ Blog: 🌐




