

Many traders make Elliott Wave more complicated than necessary. Instead of trying to memorize every pattern, start with one practical sequence: identify the trend, wait for a three-wave correction and require confirmation before entering the market.
A Simple Three-Step Process
First, determine the dominant market direction. If the larger trend points higher, avoid buying after an extended rally. Instead, let the price pull back against the trend.
Next, look for a correction that develops in three parts. Depending on its internal structure, analysts may label it A-B-C or W-X-Y. However, the message remains the same: the market is moving against the dominant trend and may offer a better location for the next trading decision.
Finally, wait for the 3-wave correction to complete and confirm your technical criteria. Define the invalidation level, calculate the risk and only then consider an entry. A three-wave correction can improve trade timing, but it does not create an automatic trading signal.
Why Patience Matters
Late entries often provide poor risk-to-reward and leave little room for normal market volatility. By waiting for a corrective structure, traders can evaluate the opportunity with clearer levels and a more disciplined plan. As a result, they avoid chasing a move that has already developed.
Practice this process on historical charts:
- Identify the dominant trend.
- Find a three-wave move against it.
- Define where the trade idea becomes invalid.
- Wait for confirmation before entering.
You do not need to master every Elliott Wave pattern before applying the method. Start with one repeatable principle:
Trend first. Correction second. Entry last.
Official trading strategy on How to trade 3, 7, or 11 swing and equal leg is explained in details in Educational Video, available for members viewing inside the membership area.
You can explore additional structures on our Free Elliott Wave Educational Page.
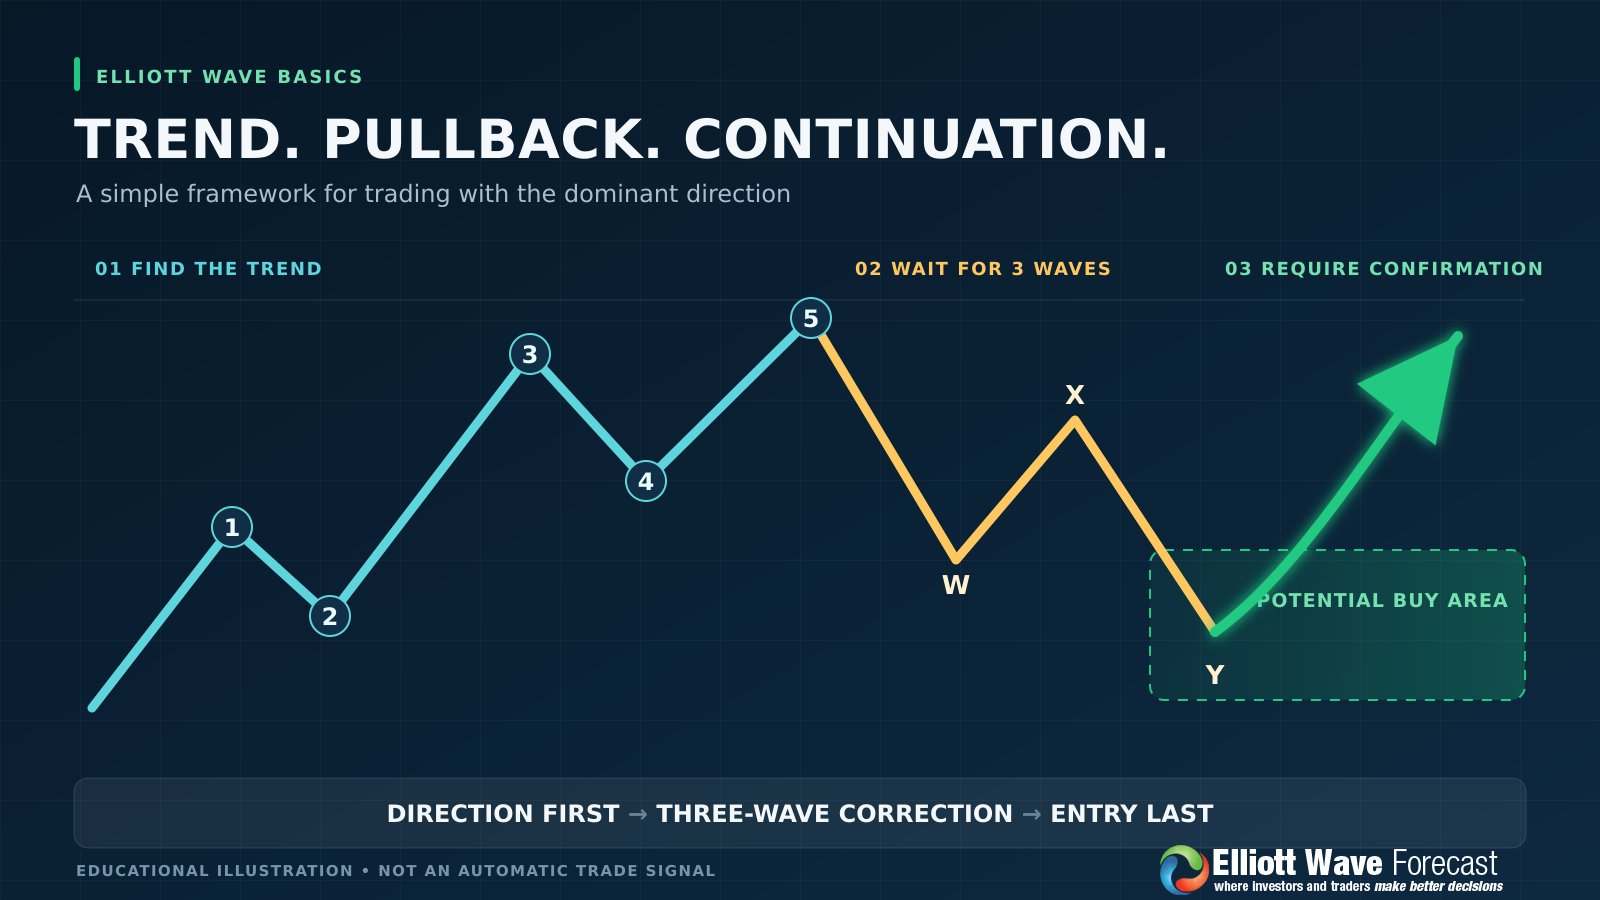
In the next section, we’ll move from theory to real-market examples and examine how the 3-wave pullback develops on actual charts. We’ll also show how traders use this structure to identify potential entry zones and define risk before entering the market.
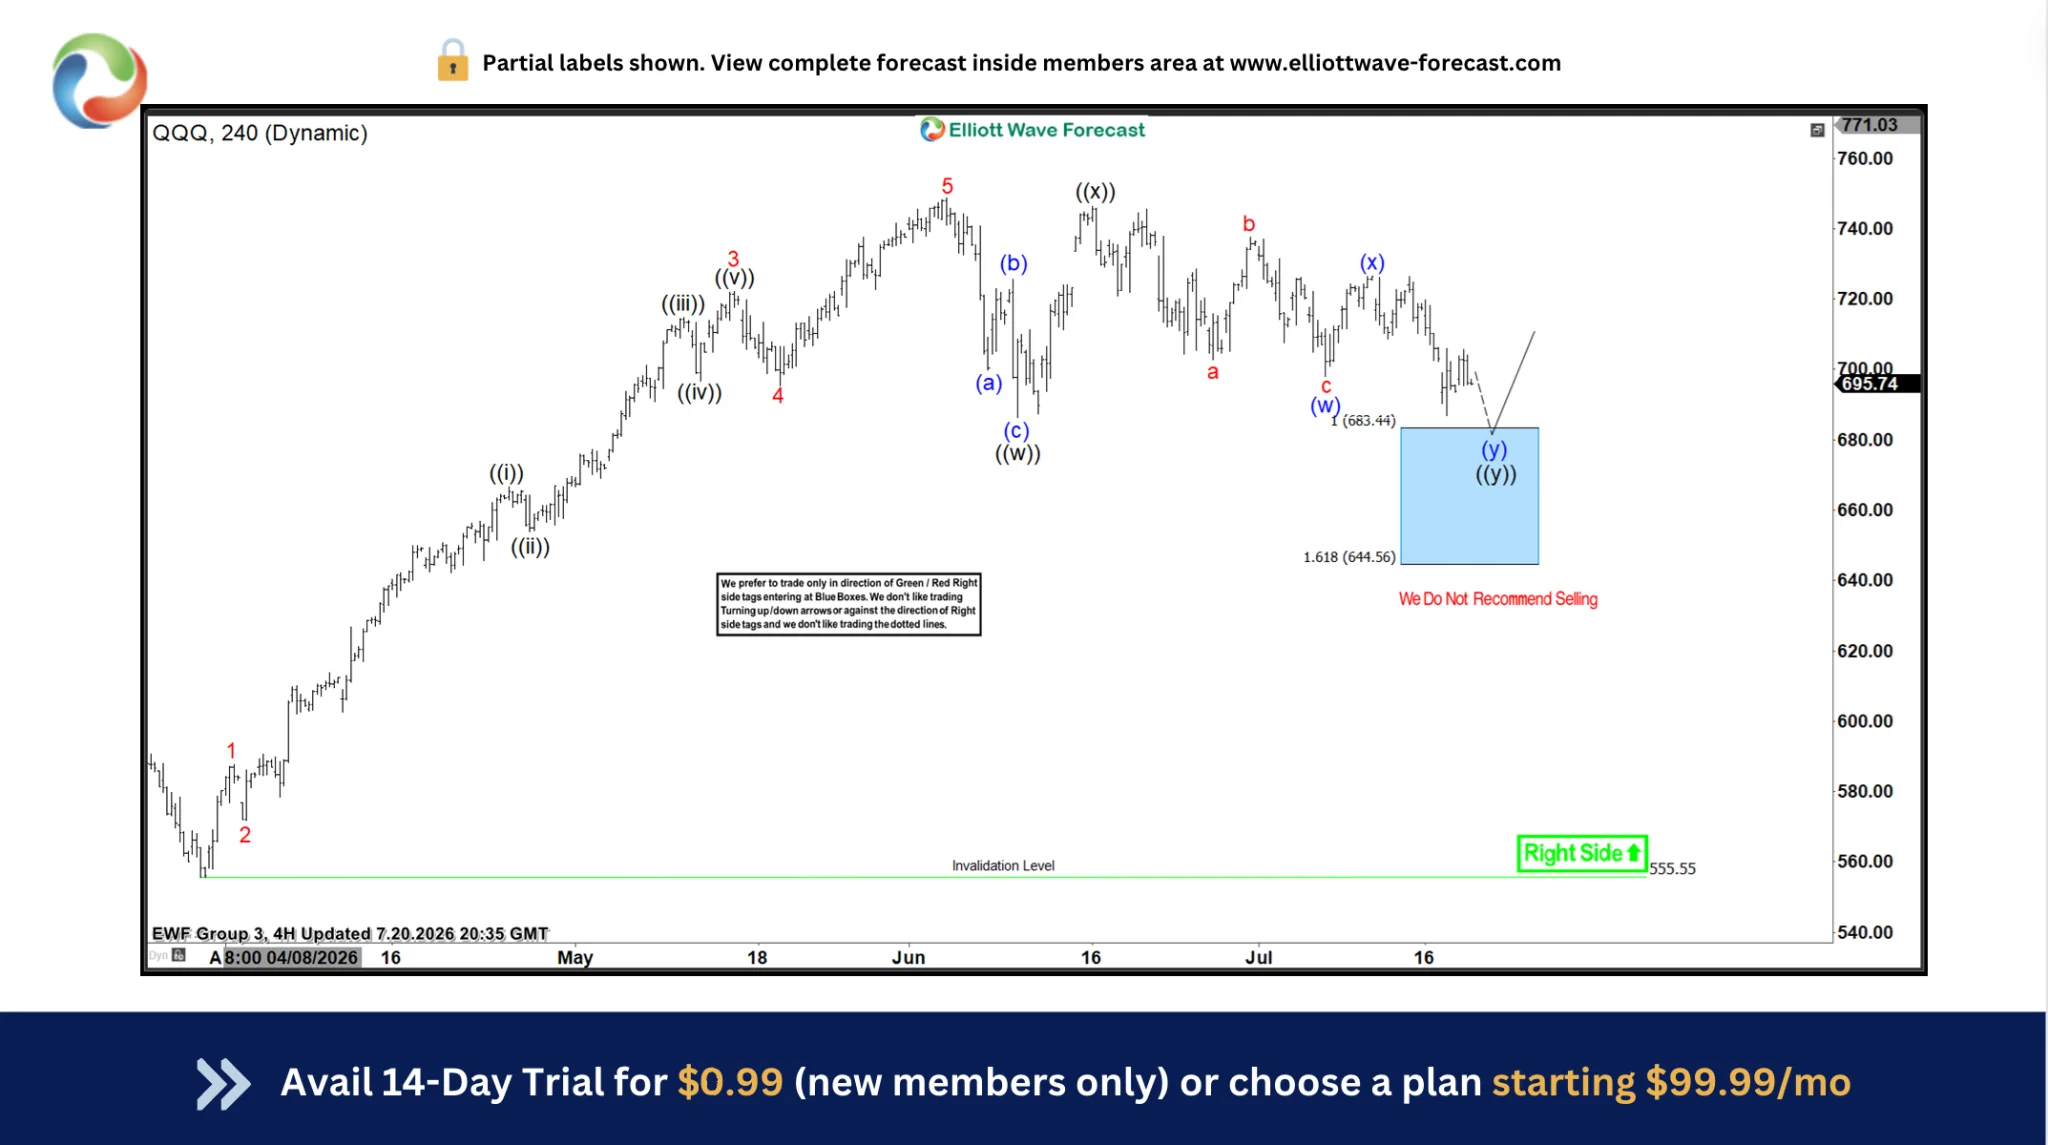
QQQ Elliott Wave 1 Hour Chart 07.20.2026
The ETF established a clear bullish trend before entering a three-wave correction, creating a potential buying opportunity. As our members know, we use the Fibonacci extension tool to measure corrective swings and identify potential entry zones with clearly defined invalidation levels.
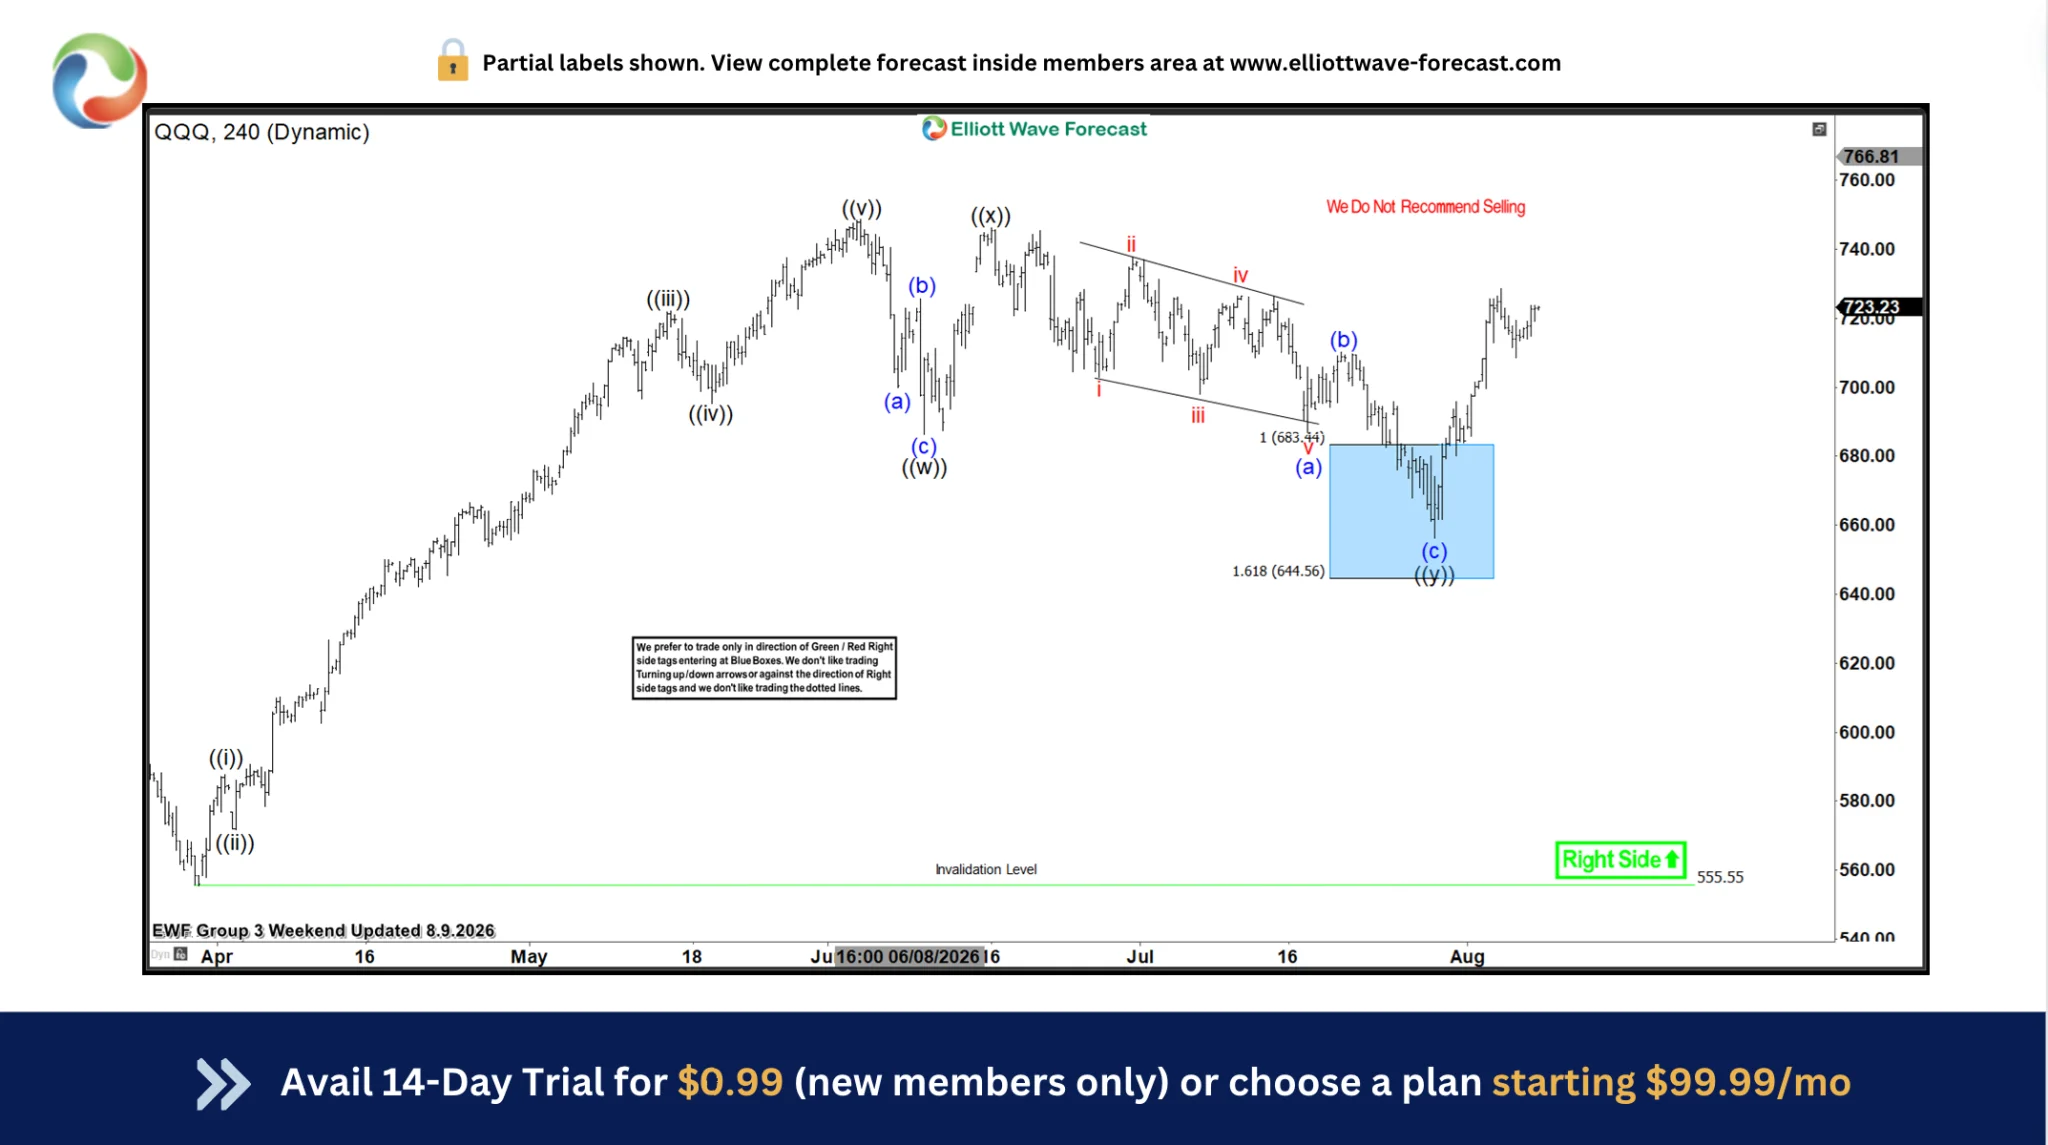
QQQ Elliott Wave 1 Hour Chart 08.09.2026
As expected, the ETF found buyers in our buying zone and delivered a solid reaction higher.
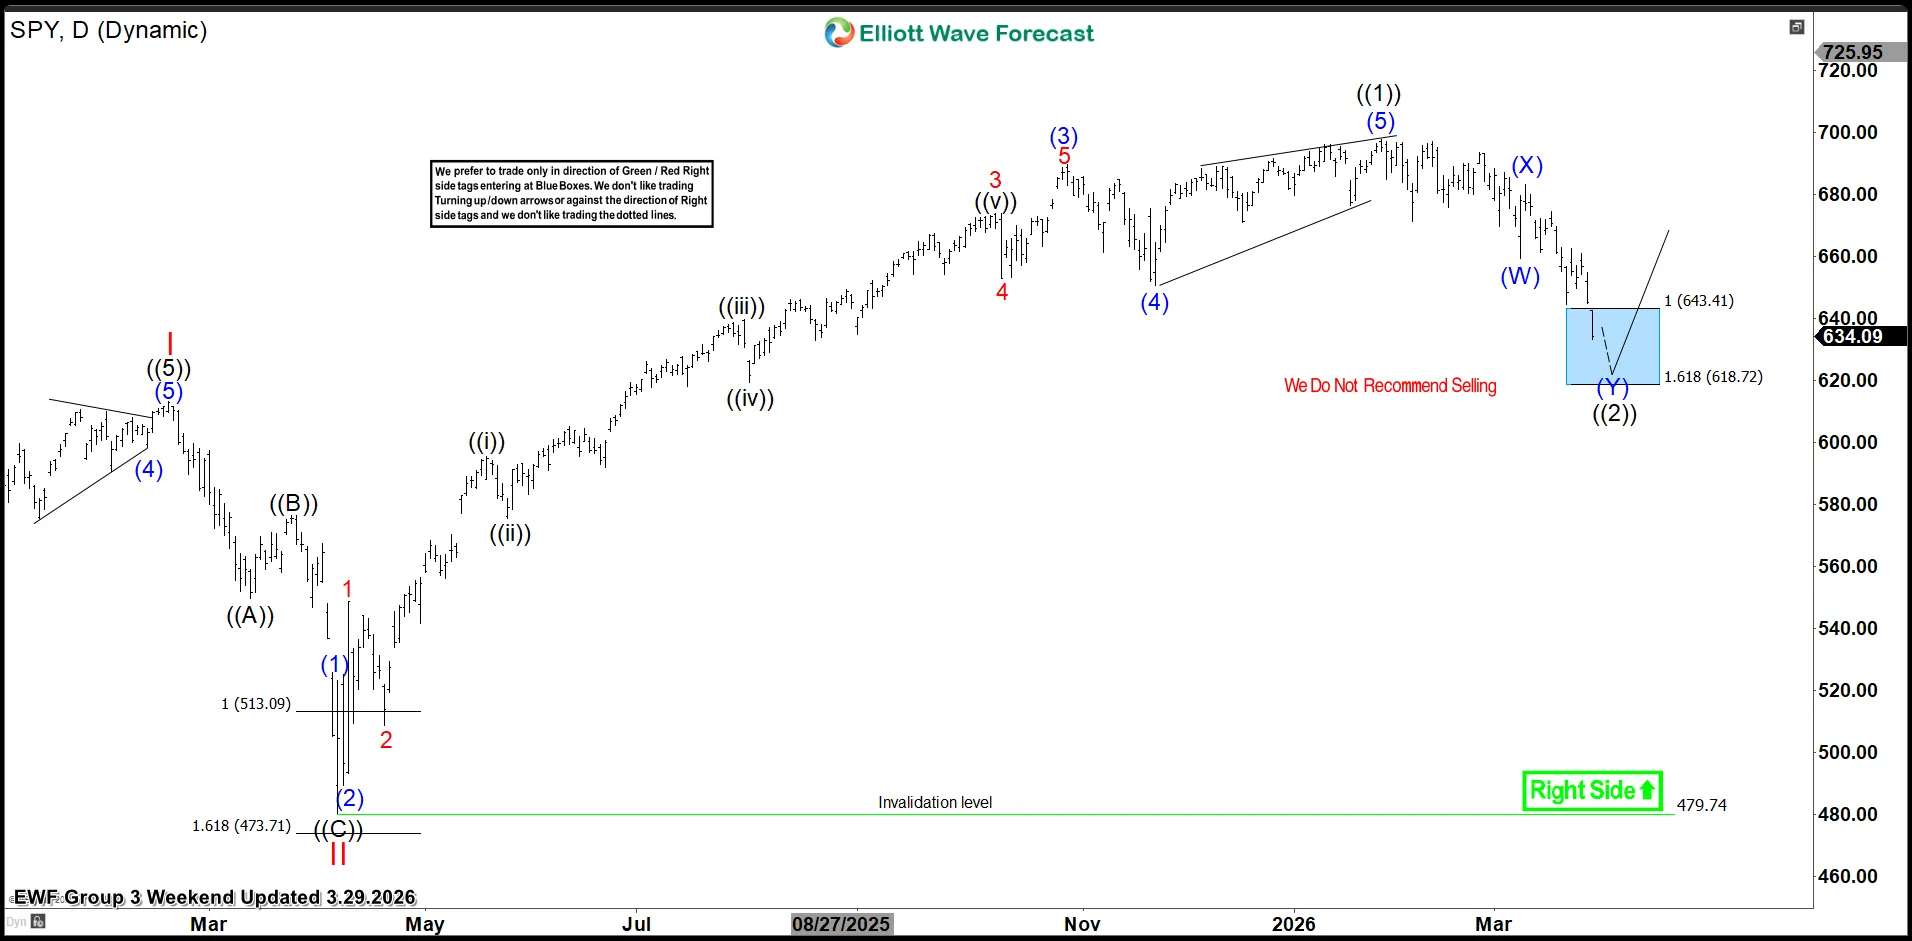
SPY Elliott Wave 1 Hour Chart 03.29.2026
SPY showed a clear bullish trend, with impulsive price sequences confirming that buyers remained in control. After the advance, the ETF developed a three-wave pullback against the dominant trend, creating a potential buying opportunity. To locate the area more precisely, we measured the correction with the Fibonacci extension tool and projected the Equal Legs zone. This calculation identified the potential entry area and allowed us to define the invalidation level in advance.
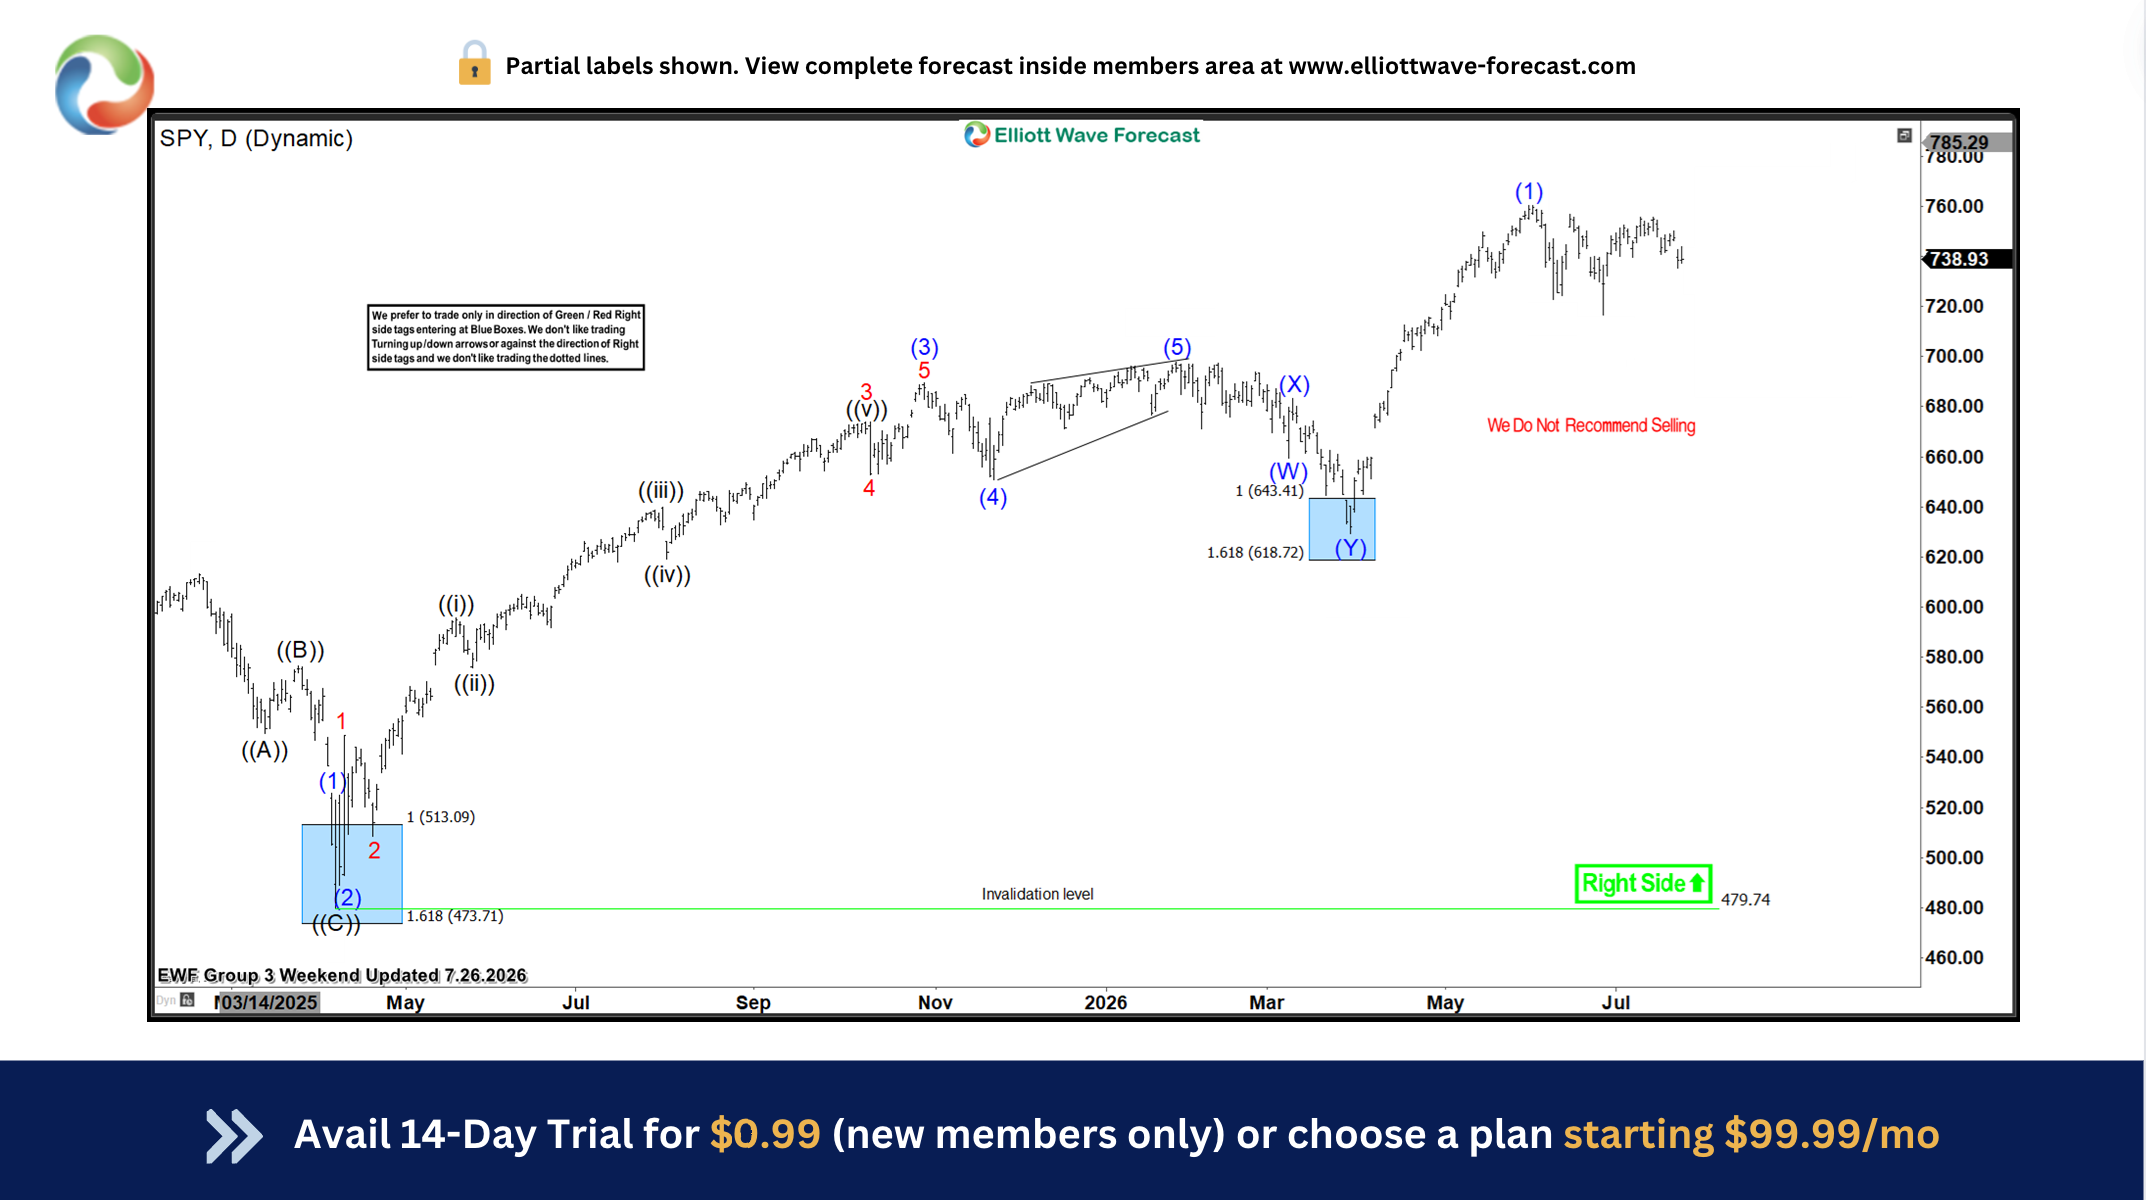
SPY Elliott Wave 1 Hour Chart 07.26.2026
As expected, SPY found buyers in the Equal Legs entry zone and delivered a strong reaction higher. Following this reaction, the ETF launched a powerful rally. Moreover, the price broke above the previous peak and continued toward new highs. As a result, the bullish sequence remained intact. Ultimately, this example shows how waiting for a three-wave correction can provide a better entry location than chasing an extended market move.
Elliott Wave Forecast Membership
Trade with a clear plan. Trade with confidence.
Our team of professional analysts monitors 78 instruments across global markets every trading day, helping members identify high-probability setups, define risk before entering, and manage positions with a structured, rules-based approach.
Inside your membership, you’ll receive:
✅ Real-Time Trading Recommendations — clearly defined Entry, Stop Loss, and Take Profit levels for every setup.
✅ Live Trading Room Access — follow professional setups and trade management as they develop in real time.
✅ 24-Hour Analyst Support — ask unlimited questions and get expert guidance throughout the trading week.
✅ Expert Multi-Market Analysis — covering Forex, Stocks, Indices, ETFs, Commodities, and Cryptocurrencies.
✅ Education Built Into Every Setup — learn how experienced analysts identify opportunities, define risk, and manage positions. Exclusive educational videos are included at no additional cost.
Stop reacting after the market moves. Start preparing before it does.
See the setups our analysts are watching, follow the market in real time, and learn the strategy behind each trade.
Your membership starts with just a few clicks.
Regular 14-Day Trial: $9.99
Limited-Time Price: Only $0.99
👉 Start Your 14-Day Trial for Only $0.99





