XBI shows steady momentum as it continues building its larger bullish cycle. However, the ETF still trades inside wave I, which keeps the door open for a deeper pullback. Because of this, traders should expect volatility to increase as the structure matures. Moreover, the next months may reveal whether buyers can defend key support levels.
Even so, the broader trend remains constructive while the cycle stays incomplete. As wave II develops, price could create a healthier base for the next advance. After that, a confirmed reaction higher would strengthen the bullish outlook. Therefore, traders should monitor the sequence closely and adapt as the structure unfolds.
Elliott Wave Structure: XBI Weekly Chart February 14th 2026
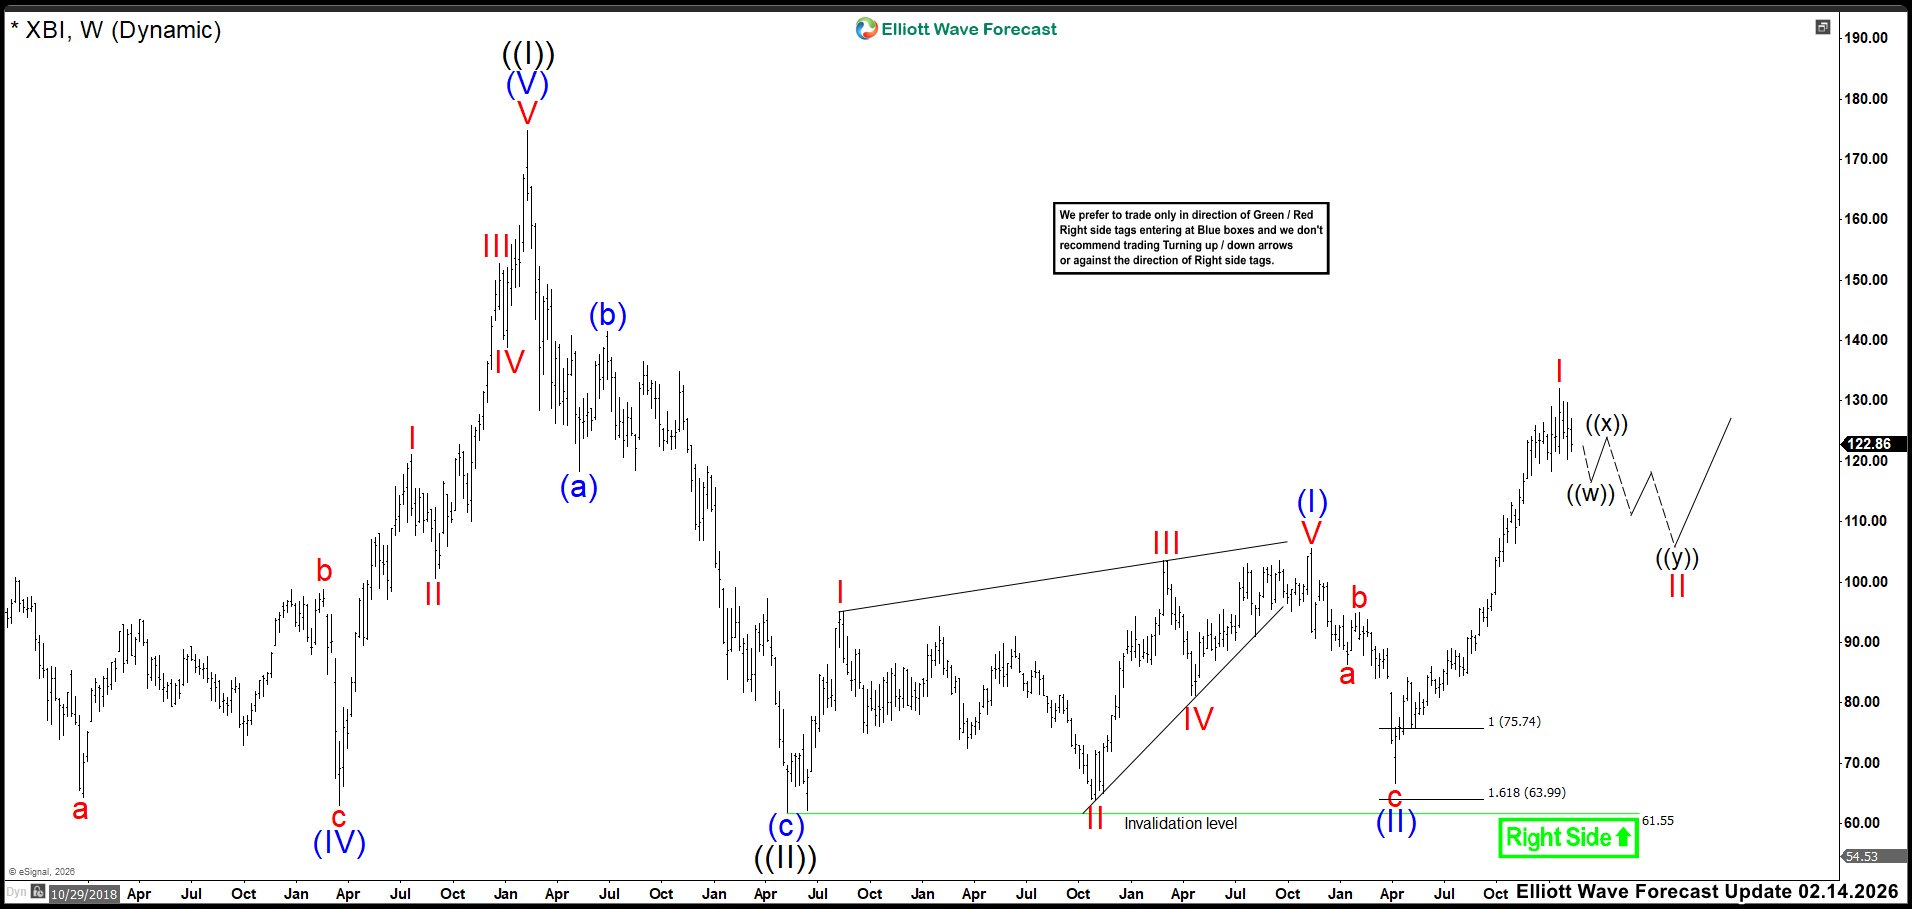
Back in February, we believed the impulse from the extreme zone had already reached 132.00 before pulling back toward 122.88. That advance delivered a gain above 62%, so we thought wave I likely ended at that stage. Yes, price could still print a marginal high above 132, but caution made more sense then. Besides, we expected choppy action until the market revealed a clear direction.
When that move appeared, we anticipated the first break to point lower. We projected a double correction as wave II, although any corrective pattern remained possible. Even a sharp drop could unfold before the bullish trend resumed. At that time, we anticipated a correction toward the 107–91 zone. That area looked promising for new buying opportunities and the next rally in wave III.
If you’re eager to dive deeper into Elliott Wave Theory and learn how its principles apply to market forecasting, you might find these resources helpful: and .
Elliott Wave Principle Behind the Market Structure
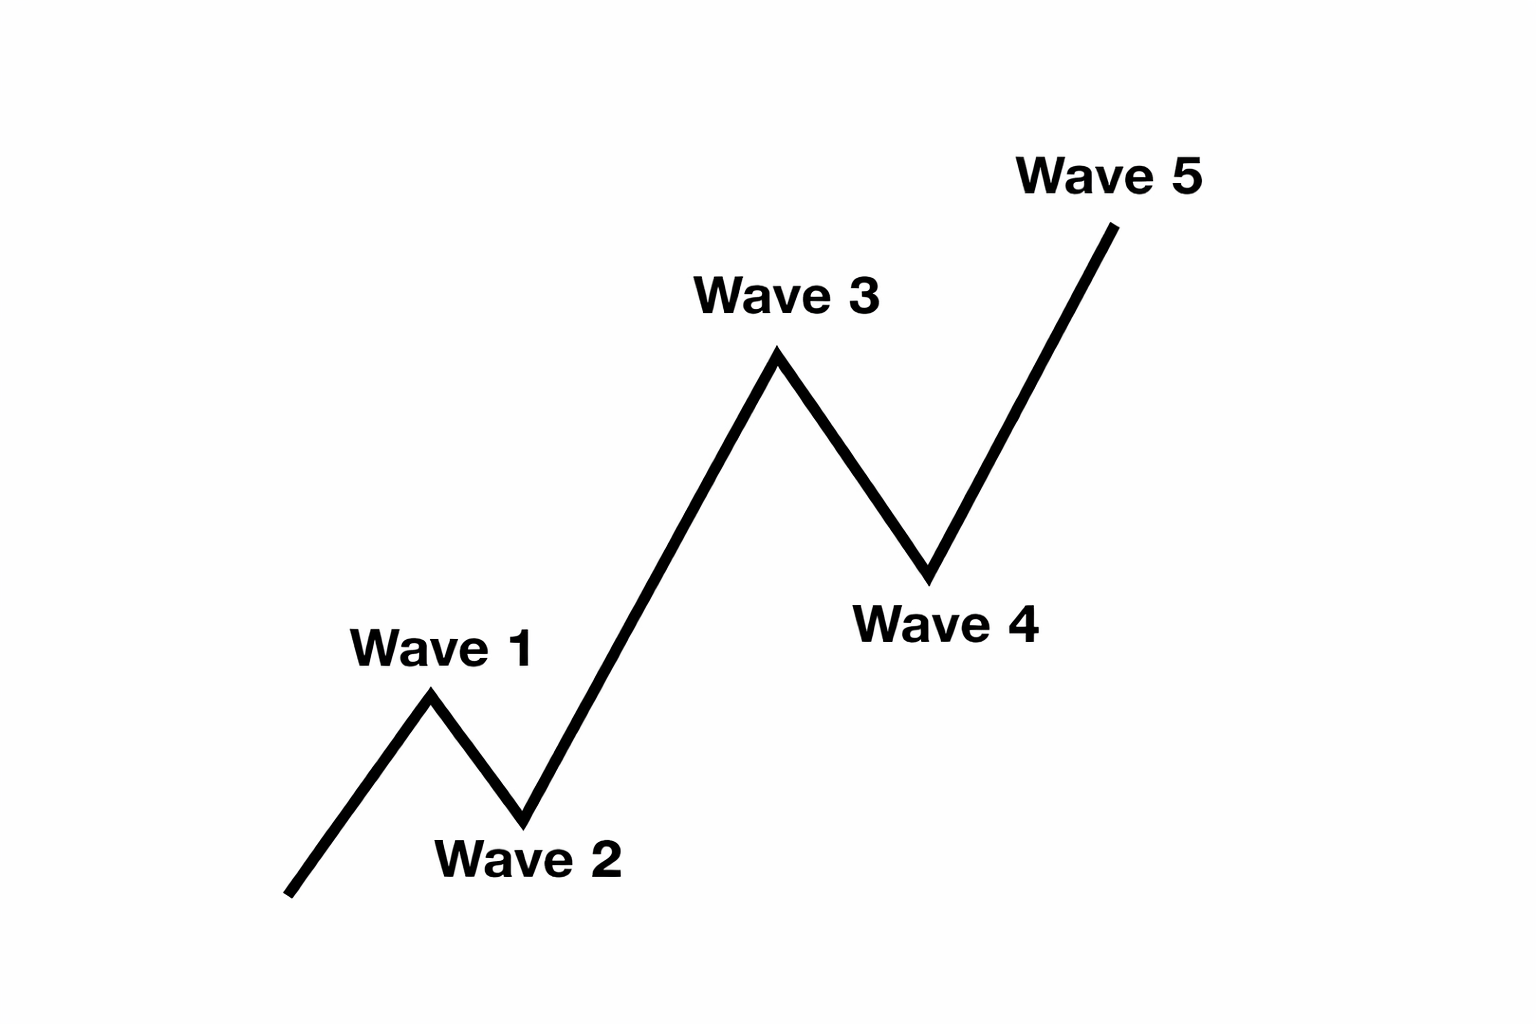
Impulse
An impulse is a clean 5‑wave pattern that drives the trend forward.
- Waves 1‑3‑5 are strong and directional.
- No overlap between waves 1 and 4.
- Wave 3 is usually the strongest.
- Structure is clear, with increasing momentum.
Elliott Wave Structure: XBI Weekly Chart June 1st 2026
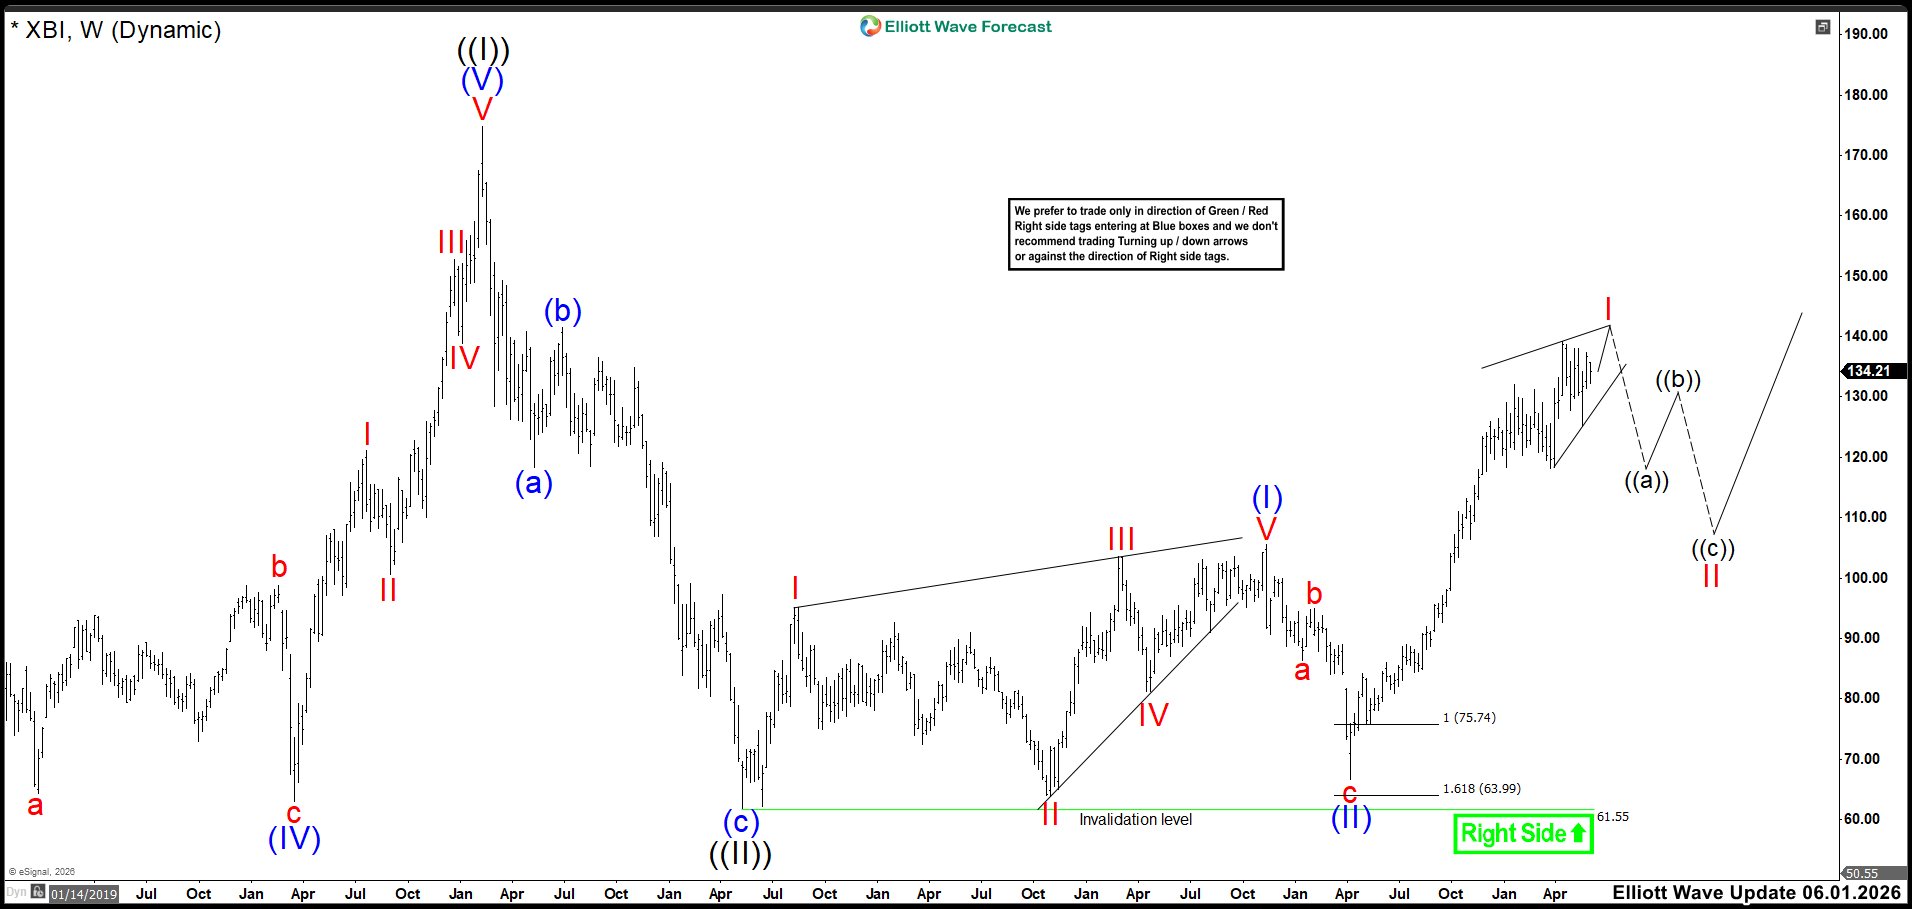
XBI currently shows lagging momentum, which suggests the correction should appear soon. However, only a strong bullish move would invalidate this view. Therefore, we expect wave I to complete a leading diagonal with one more high, possibly near 142.60. If price shows a strong bearish reaction at that level, we will consider wave I completed and the expected correction underway.
If we do not see that bearish reaction and price keeps lagging, we cannot rule out additional upside. Even so, the structure still favors a pending correction before the next bullish phase.
Transform Your Trading with Elliott Wave Forecast!
Ready to take control of your trading journey? At Elliott Wave Forecast, we provide the tools you need to stay ahead in the market:
Blue Boxes: Stay ahead in the market with fresh 1-hour charts updated four times daily, daily 4-hour charts on 78 instruments, and precise Blue Box zones that highlight high-probability trade setups based on sequences and cycles.
Live Sessions: Join our daily live discussions and stay on the right side of the market.
Real-Time Guidance: Get your questions answered in our interactive chat room with expert moderators.
🔥 Special Offer: Start your journey with a 14-day trial for only $0.99. Gain access to exclusive forecasts and Blue Box trade setups. No risks, cancel anytime by reaching out to us at support@elliottwave-forecast.com.


