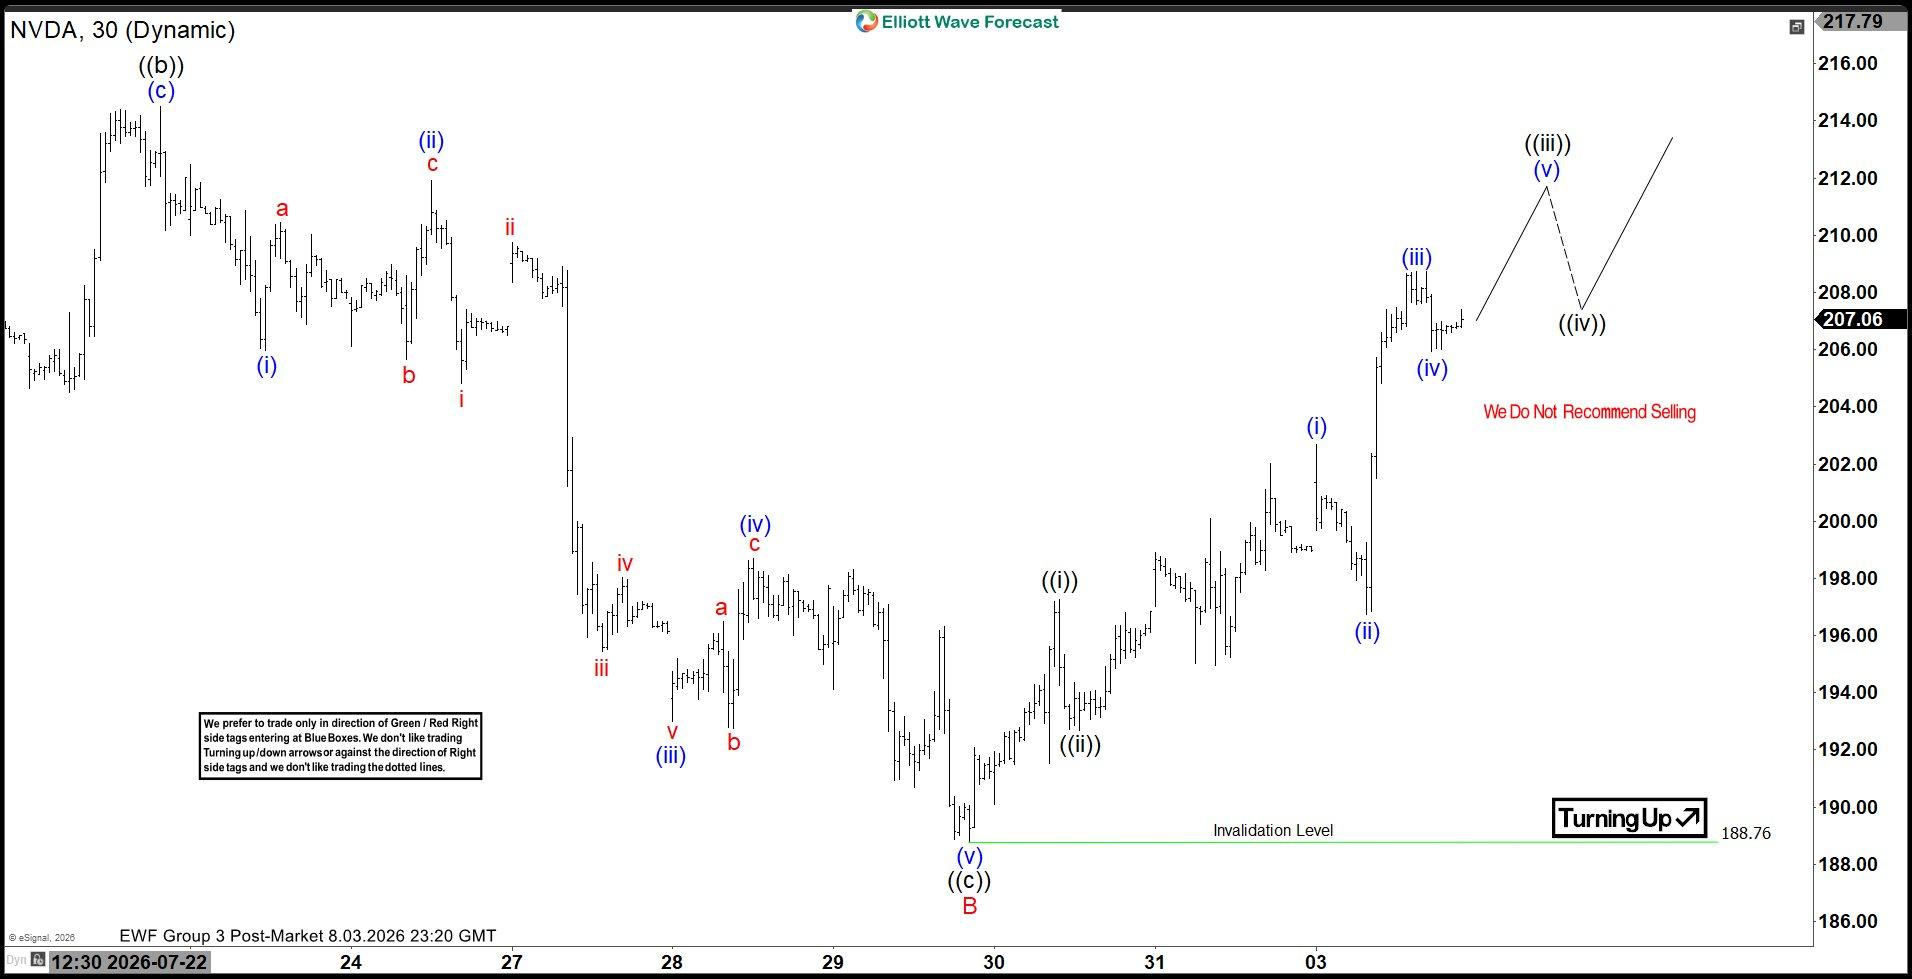
NVIDIA (NASDAQ: NVDA) continues to follow our Elliott Wave forecast as the stock advances in red wave C to complete wave (B) of a larger Flat correction. The rally from the 188.76 low remains incomplete, keeping buyers in control over the short term. As long as NVDA holds above 188.76, the bullish outlook remains intact and favors further upside.
The 30-minute Elliott Wave chart shows wave C developing as a five-wave impulsive advance, a common pattern in a Flat correction. The current bullish sequence remains incomplete, indicating that NVDA stock should continue higher before this corrective rally ends. Fibonacci analysis projects the completion of wave C between the 100% and 161.8% extensions of wave A, creating a target zone between 213 and 229. This area also marks a high-probability resistance zone where wave (B) could end and the next bearish leg could begin.
Our NVDA technical analysis continues to favor additional upside over the next 24 hours. Traders can look to buy pullbacks while price remains above 188.76. However, attention should shift to the 213–229 resistance zone, where momentum could fade. A completed five-wave advance in red wave C would likely signal the end of wave (B) and the start of the next corrective decline.
NVDA 30 Min. Elliott Wave Chart