Lam Research Corporation (LRCX) designs, manufactures, markets, refurbishes & services semiconductor processing equipment used in the fabrication of integrated circuits in the US, China, Korea, Taiwan, Japan, Southeast Asia & Europe. It comes in Technology Semiconductor sector & trades as “LCRX” at Nasdaq.
LRCX favors bullish impulse rally in weekly in I of (III) started from April-2025 low. It favors upside in ((5)) of I towards $262.90 – $280.83 area, while dips remain above 2.05.2026 low. The chasing longs at the moment can be risky as it may ended the I at last peak, if breaks below February-2026 low. We like to buy the pullback in clear 3, 7 or 11 swings in II sequence at extreme area.
In weekly, it ended (I) of ((III)) at $113 high in July-2024 & (II) at $56.36 low in April-2025 within the rally from October-2022. Above $56.36 low, it favors rally in I of (III) & showing 13 swings from April-2025 low. It expects two more highs, while pullback holds above 2.05.2026 low to end I into $262.90 – $280.83. In daily, it placed ((1)) of I at $167.15 high, ((2)) at $135.50 low, ((3)) at $251.87 high & ((4)) at $204.57 low. Within ((1)), it ended (1) at $108.02 high, (2) at $94.11 low, (3) at $153.69 high, (4) at $131.02 low & $167.15 high. Within ((3)), it placed (1) at $169.69 high, (2) at $153.60 low, (3) at $236.10 high, (4) at $213.87 low & (5) at $251.87 high.
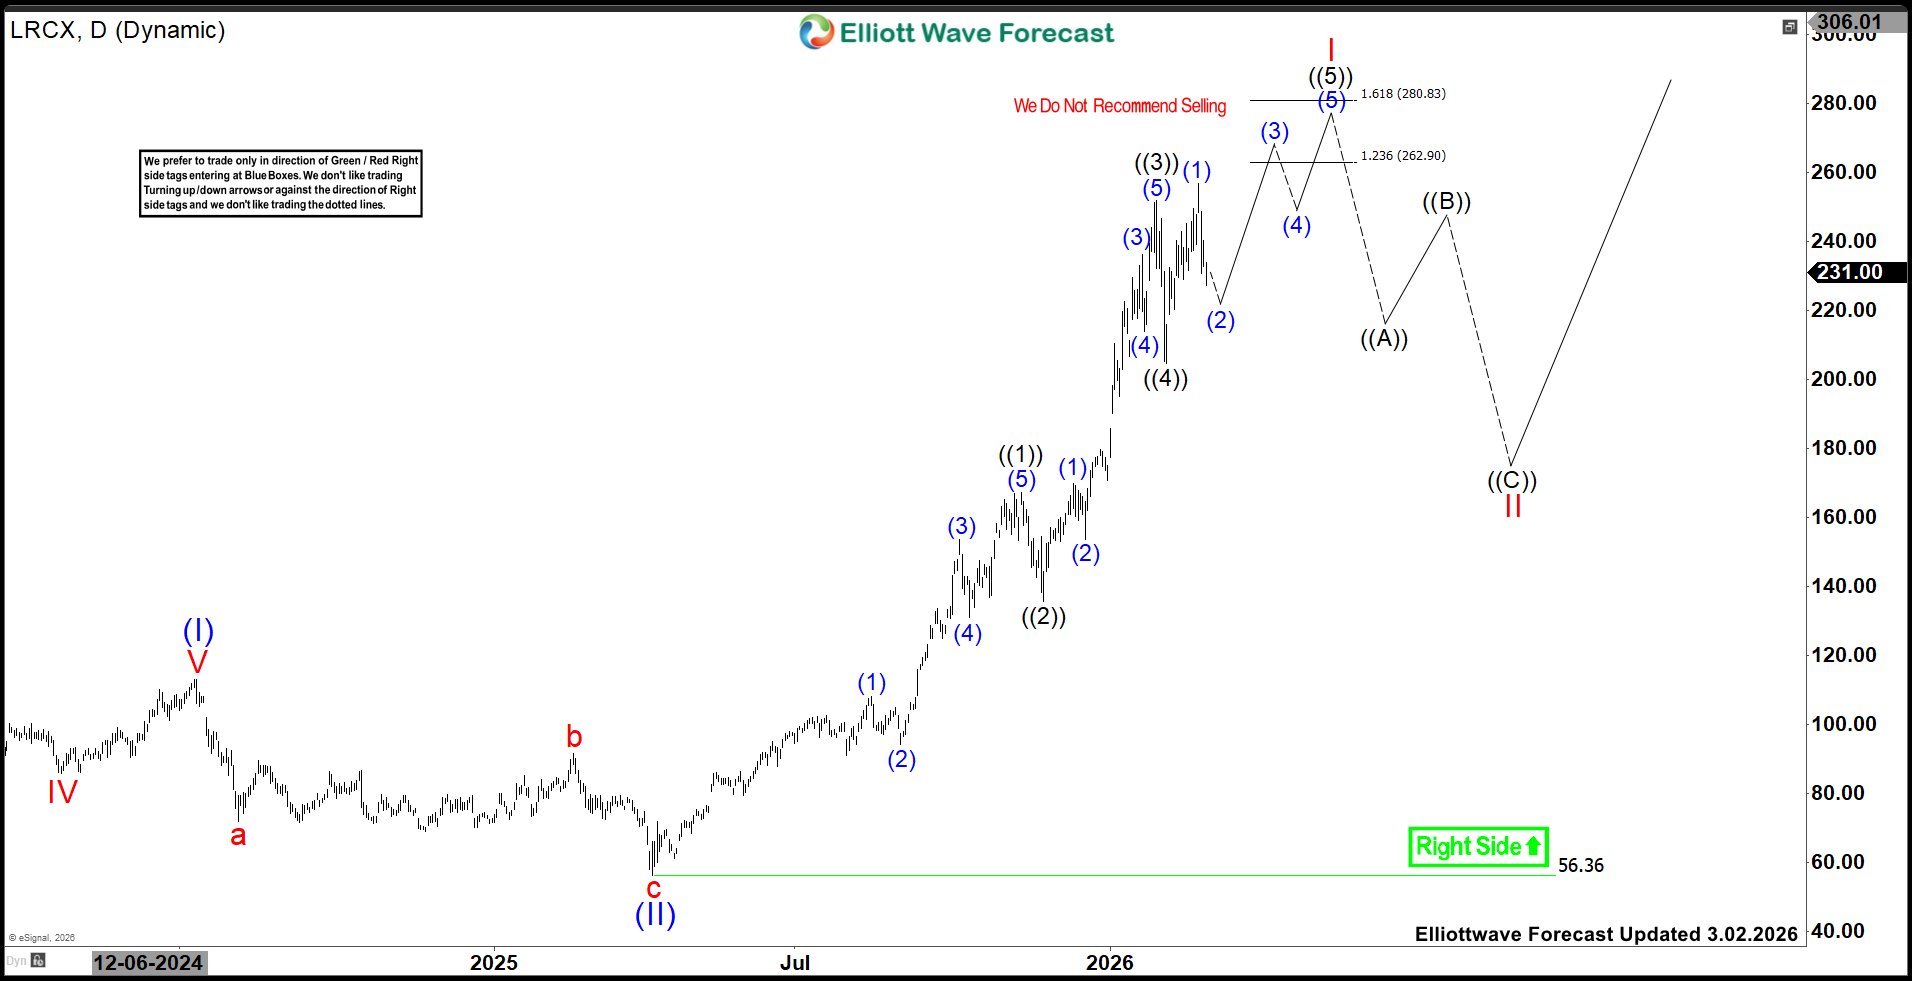
Above ((4)) low of $204.57, it ended (1) at $256.68 high & favors pullback in (2). It should find support soon to extend higher in (3), which will confirm above $256.68 high. Once it breaks above (1) high, it should expect two or more highs to end ((5)) into $262.90 – $280.83 area as wave I. Alternatively, if it breaks below $204.57 low, it should be correcting in ((A)) of II, while called I ended at $256.68 high. We like to buy the pullback in II in 3, 7 or 11 swings at extreme area against April-2025 low.
LRCX is not the part of regular service at EWF. But we provide time to time updates on instruments under blog section. Elliottwave Forecast updates 1-hour charts four times a day & 4-hour charts once a day for all our 78 instruments. We do a daily live session, where we guide our clients on the right side of the market. In addition, we have a chat room where our moderators will help you with any questions you have about what is happening in the market at the moment. You can try us for 14 days for only $0.99 (limited time offer). Also, you can check out the Educational section to learn Elliott wave theory & its application through different packages available & 1-1 coaching for doubts.