

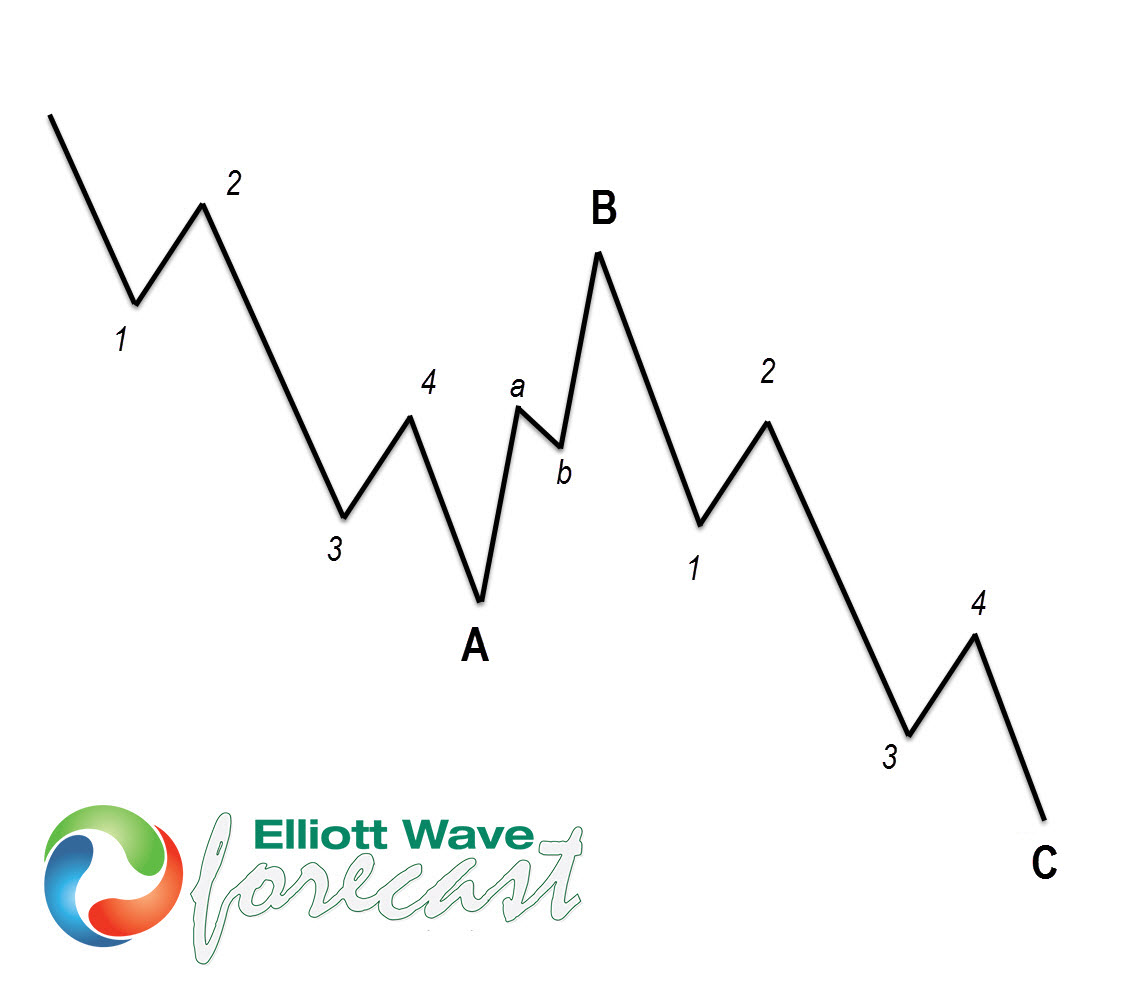
Zig-Zag or ABC is the most popular corrective pattern in Elliott Wave Theory. At the mention of the word “correction” many Elliott Wave practitioners would think of a Zig-Zag pattern and that’s one of the traps in modern analyzing .
The Evolution of Market Patterns
It’s important to understand that the market is not the same as it was in the 1930s when Ralph Nelson Elliott developed the analytical tools that practitioners today call Elliott Waves. Most long-term EWF members already know that the WXY (Double Three) pattern is also common in today’s markets. In the following text, we will go through these patterns and explain the differences.
Elliott Wave Zig-Zag Pattern
Zig zag iz corrective Elliott Wave pattern made of 3 swings which have 5-3-5 inner structure. It’s labeled as A,B,C where A =5 waves, B=3 waves and C=5 waves. That means A and C are impulsive and they must meet all conditions of being 5 wave structure, such as: having RSI divergency between wave subdivisions, ideal Fibonacci extensions, retracements and so on… more on that topic could be find in Impulsive 5 wave structure – ground rules page.
Elliott Wave Double Three pattern:
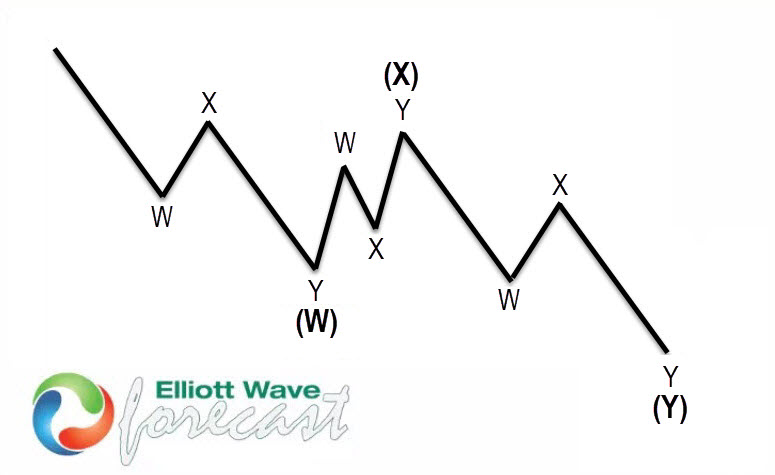
Double three or WXY is one of the most important patterns in New Elliott Wave theory and very common corrective pattern in the market nowadays, also known as 7 swing structure. Wave subdivision is 3,3,3 which means all of these 3 waves are corrective sequences. In other words, each wave W, X or Y could have almost any corrective structures: double three, triple three, zigzag, flat, triangle, or any complex combinations. There are few exceptions that only one of them could be triangle and wave W can’t be a triangle structure.
The picture below presents what Elliott Wave Double Three pattern looks like. It has (W),(X),(Y) labeling and 3,3,3 inner structure, which means all of these 3 legs are corrective sequences. They’re also having W,W,Y structure in lower degree or alternatively A,B,C.
Let’s see what the WXY Elliott Wave Double Three pattern looks like in a real market example.
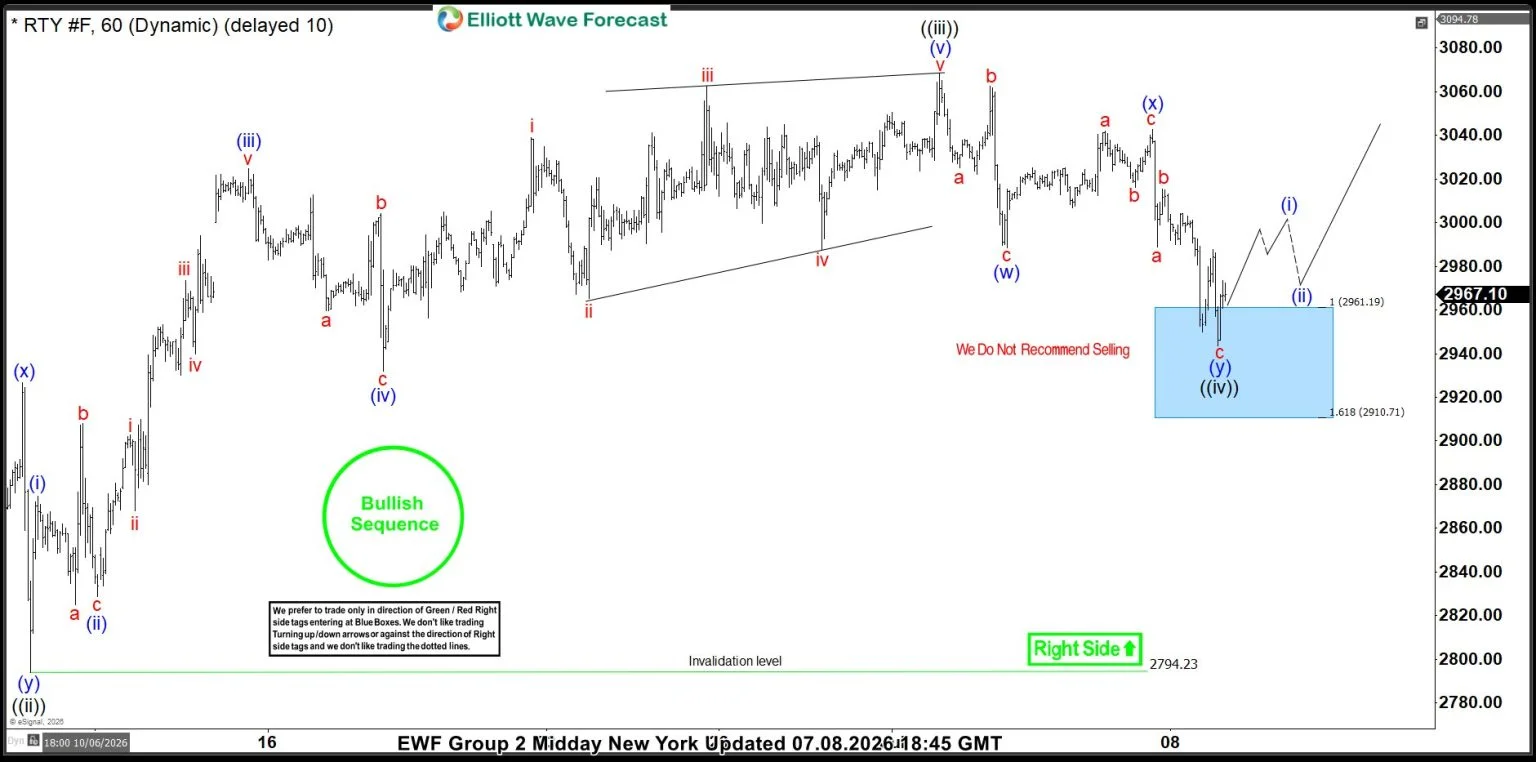
Russell RTY_F Elliott Wave 1 Hour Chart 07.08.2026
As the chart shows, we are in a (W)-(X)-(Y) structure.
- (W) Wave is a three-wave Zig Zag structure labeled as red abc.
- (X) Wave is a recovery in the form of a Double Three structure labeled as red abc.
- (Y) Wave is a Zig Zag structure labeled as red abc.
The chart below shows the completed Double Three structure, calling the rally from our Buying Zone.
Let’s see what the ABC Zig Zag Pattern looks like in a real market example.
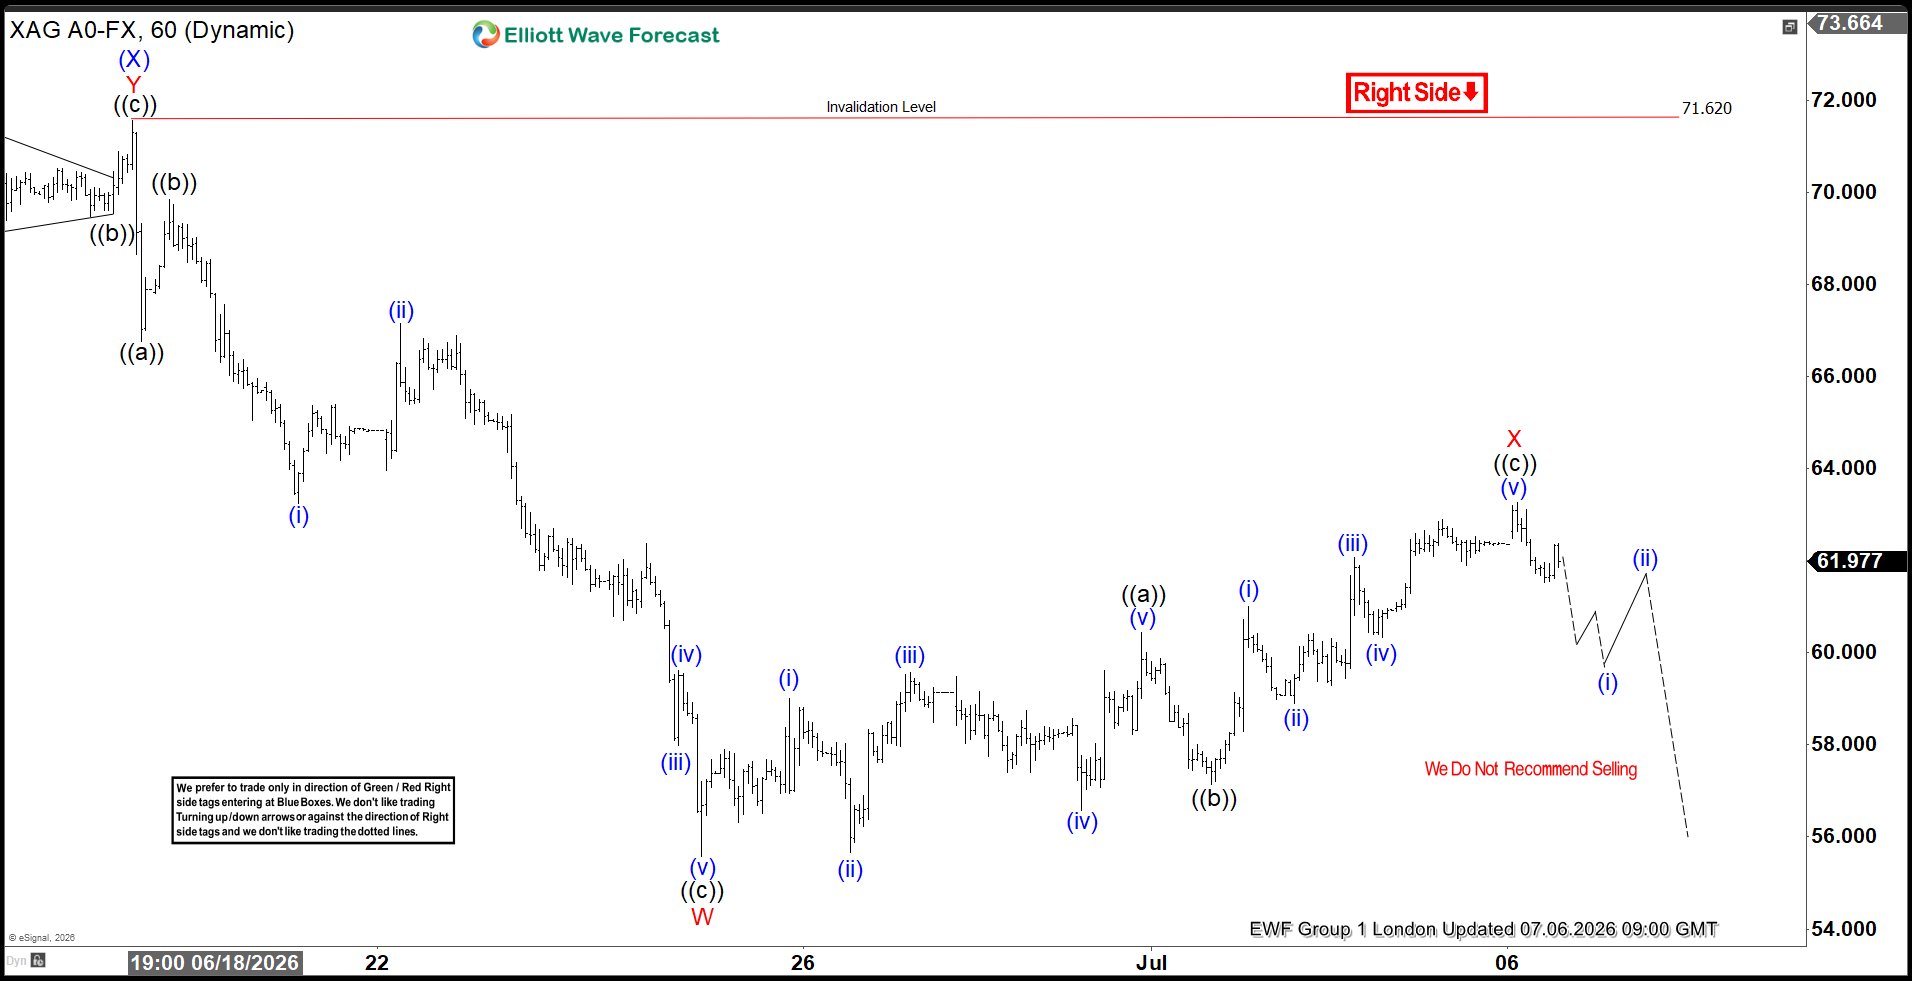
SILVER XAGUSD Elliott Wave 1 Hour Chart 07.06.2026
We can see a clear Elliott Wave Zig Zag pattern, marked as ((a))-((b))-((c)) in the image below.
- ((a)) Wave is a 5-wave structure.
- ((b)) Wave is a pullback in the form of a Double Three structure (3 waves).
- ((c)) Wave is a 5-wave structure.
The chart suggests further weakness in Silver after the completion of the Zig Zag recovery.
Ready To Trade Like A Professional?
They prepare before the opportunity appears.
Every day, our team of Elliott Wave analysts does exactly that—tracking 78 global markets, identifying high-probability setups, and helping members stay one step ahead.
Because successful trading isn’t about predicting every move.
It’s about following a proven process with discipline and confidence.
If you’re ready to stop guessing and start trading with a structured plan, this is where your journey begins.
Try Elliott Wave Forecast free for 14 days for just $0.99—and experience the difference professional analysis can make.
Offer Expires Soon!
Get full access to real-time Signals, Live Sessions, 24 Hour Chat Room Support and Expert Analysis — all for only $0.99 during your 14-day trial.
⏳ This limited-time price will expire soon — don’t miss out!


