

After reaching its all-time high, TLN completed a five-wave advance with gains exceeding 880%. Since its September 2025 peak, the stock has been correcting this rally in a clear seven-swing structure. In this blog post, we analyze the pullback structure and identify the support zone where long-term investors can look to re-enter the market.
Talen Energy (NASDAQ: TLN) is a leading independent power producer in the United States, operating a diversified portfolio of nuclear, natural gas, coal, and oil-fired generation assets. The company supplies electricity, capacity, and ancillary services to wholesale power markets while expanding its role in powering AI-driven digital infrastructure, making it a key player in the evolving U.S. energy sector.
TLN Elliott Wave Analysis – Weekly Chart, 17th August, 2026
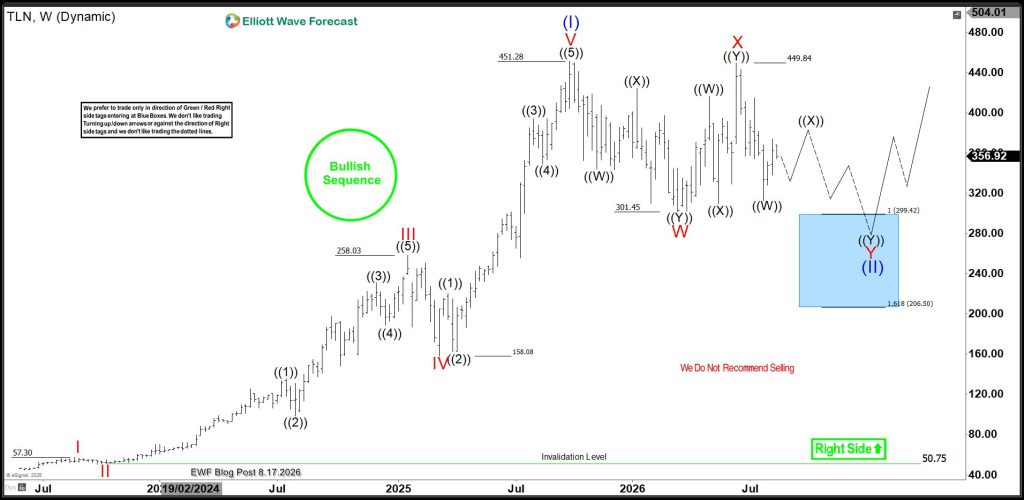
Following its launch in the secondary market in May 2023 at approximately $46, Talen Energy rallied over 800% in just 29 months. Applying Elliott Wave theory, this price action reflects a textbook impulse structure. The initial bullish cycle began with Wave I, which climbed to $57.30 by August 2023, followed by a corrective Wave II pullback that found support at $50.75 in October 2023.
From the low of October 2023, the first major breakout happened. the stock price rallied from barely $50.75 to $258 to finish wave III in January 2025. from the top of January 2025, wave IV pullback followed and pressure price to $158 to create a low in March 2025. Wave V of (I) started in March 2025 and roared to the all-time high of $451 in September 2025.
According to the Elliott wave theory, a 3-wave corrective cycle should follow a 5-wave impulsive cycle. In this case, the first bullish phase has completed as wave (I). The pullback from the September 2025 high is clearly evolving as a corrective cycle for wave (II). At the end of wave (II), the stock could record some of it’s biggest rallies as the 3rd waves are usually stronger than the first wave. Realistically, the target for wave (III) could be as high as $950 or more.
Elliott Wave 5-3 Cycle
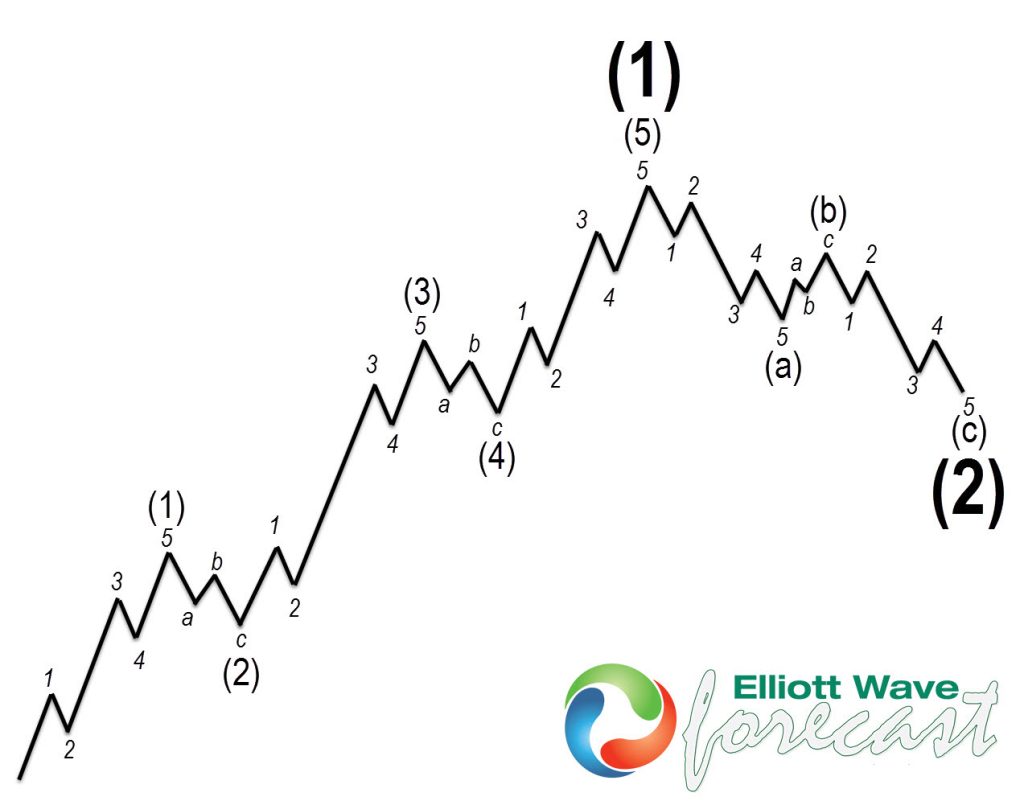
The Elliott Wave Theory’s 5–3 cycle is the foundation of market structure. It describes how prices move in the direction of the main trend with 5 waves, followed by a 3-wave correction.
-
Waves 1, 3, and 5: Impulsive waves that advance the dominant trend.
-
Waves 2 and 4: Corrective pullbacks within the impulse.
-
Waves A, B, and C: A three-wave correction that retraces the completed five-wave move before the larger trend resumes.
This repeating 5–3 pattern appears across all timeframes, helping traders identify trend direction, corrective phases, and high-probability trading opportunities.
What Next For Investors?
The current corrective phase for Wave (II) is unfolding as a double zigzag structure. As highlighted on the weekly chart, the stock is currently navigating toward the identified blue box support zone between $299 and $206. We anticipate that this area will generate renewed buying interest. For long-term investors, initiating a position near the $299 level with a target exit of $950 offers a compelling opportunity to capture significant future upside.
About Elliott Wave Forecast
At www.elliottwave-forecast.com, we update one-hour charts four times daily and four-hour charts once daily for all 78 instruments. We also conduct daily live sessions to guide clients on the right side of the market. Additionally, we have a chat room where moderators answer market-related questions. Experience our service with a 14-day trial for only $0.99. Cancel anytime.


