The SPDR S&P 500 ETF Trust (SPY) is correcting the March 2026 cycle amid the long term bullish trend. Coming from a fresh record high, how can the current correction evolve and how should traders prepare?
The SPDR S&P 500 ETF Trust (SPY) is one of the most widely traded exchange-traded funds (ETFs) in the world. Designed to track the performance of the S&P 500 Index, SPY provides investors with exposure to 500 of the largest publicly traded companies in the United States across various sectors. As a benchmark for the broader U.S. equity market, SPY is closely watched by traders and investors seeking to gauge market sentiment, identify trends, and capitalize on opportunities in the world’s largest economy.
The SPY remains in a strong long-term bullish cycle, currently tracking within the 5th grand supercycle degree wave that originated from the February 2009 low. This secular trend is expected to unfold over several years, if not decades. Our weekly analysis indicates that the supercycle degree wave (III) of ((V)) began at the October 2022 low, with the ETF successfully establishing a series of bullish nests. Specifically, wave I peaked in February 2025, followed by a corrective wave II that bottomed in April 2025. This subsequent bullish phase signals the commencement of wave III, which carries a potential target range of 912-1078, likely unfolding in an extended structure. Furthermore, the cycle initiated in April 2025 concluded in January 2026, marking the completion of wave ((1)). Following a corrective sequence for wave ((2)), a fresh bullish cycle for wave ((3)) emerged in March 2026, confirming the resumption of the primary uptrend.
Wave ((3)) extended above wave ((1)) as expected and has the potential to extend to 899-982. Meanwhile, the new bullish cycle from late March 2026 appears to have finished to complete wave (1) of ((3)). Thus, wave (2) pullback is in motion. In recent trades, we traded the extremes of waves II and ((2)) and would like to trade the extreme of wave (2) as well. In bullish sequences, we recommend to our members to go long from the blue box we provide. Meanwhile, as the wave (2) pullback evolves, here are two of the most likely way it could play out.
SPY Elliott Wave Analysis – wave (2) as a double zigzag – 7/swing structure
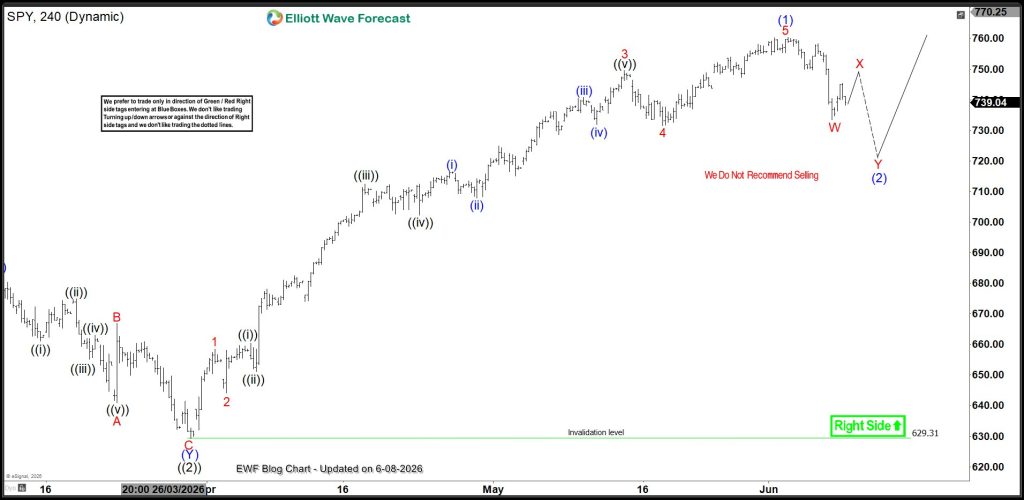
The weekly chart above shows a double zigzag structure could be evolving for wave (2). However, it will require another leg higher to finish the wave X connector. After the connector, another 3-wave structure could emerge down to complete wave Y of (2). At the end, we like to buy from the blue box where wave (2) could finish. However it’s important to note that the pullback could extend deeper into a 15-swing corrective sequence. However, there should be at least a 3-swing bounce to take book some profits for our members. On the other hand, if there is no more leg higher and price drops instead. In that case, the scenario below could play out.
SPY Elliott Wave Analysis – wave (2) as a simple zigzag – 7/swing structure
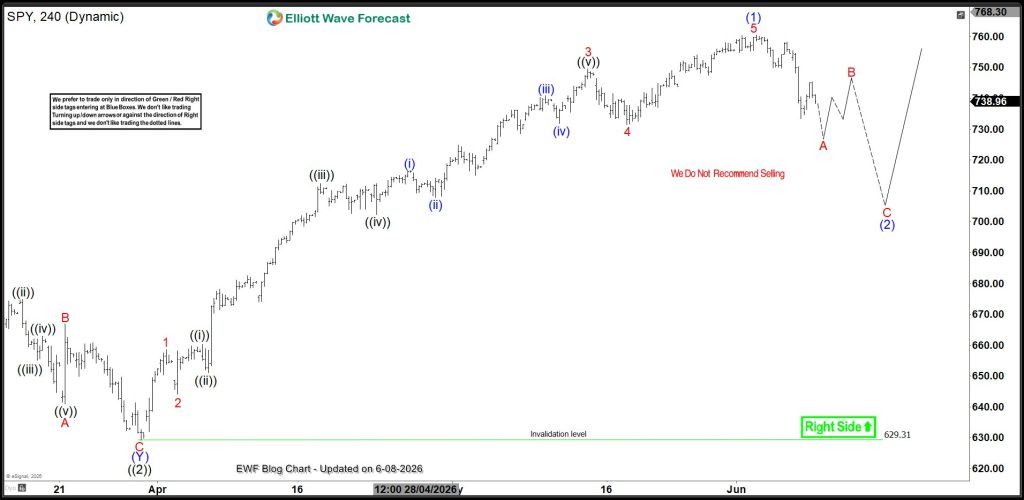
From the top of wave (1), price has only completed 4 swings and currently on the 5th. However, the 5th swing could turn upside to extend the 4th swing. That fits the first scenario discussed above. However if the 5th swing pushes lower below the 4th swing, we can get a clear impulse wave structure for wave A. Afterwards, a correction for wave B and another 5-wave lower for wave C could follow to finish wave (2). This corrective scenario should be deeper than the first scenario. We also like to buy from the blue box as well.
We will monitor this 24 hours and alert members which structure will work and the blue box to trade from.
In the meantime, we invite you to join thousands of active members and start trading the blue boxes on the 78 instruments we cover daily. JOIN HERE FOR A 14 DAYS TRIALS FOR JUST $0.99
About Elliott Wave Forecast
At www.elliottwave-forecast.com, we update one-hour charts four times daily and four-hour charts once daily for all 78 instruments. We also conduct daily live sessions to guide clients on the right side of the market. Additionally, we have a chat room where moderators answer market-related questions. Experience our service with a 14-day trial for only $0.99. Cancel anytime.


