SMH starts June near critical support after a strong multi‑month rally. Buyers still control the broader trend, yet momentum shows signs of fatigue. Therefore, the next weeks may deliver sideways action while the sector resets. Still, the medium‑term structure favors upside if key levels hold and rotation stays healthy.
Looking into July and August, SMH may attempt a new bullish leg if demand strengthens. Moreover, mid‑summer seasonality often supports tech and boosts risk appetite. Earnings updates could also trigger sharp moves across semiconductor names. Consequently, traders should monitor SMH around its pivot zones because those reactions will shape the three‑month outlook.
Elliott Wave Outlook: SMH Daily Chart March 8th, 2026

SMH broke above 152 and confirmed an extended impulse. This move forced us to adjust the count and include the new extension. Wave ((1)) ended at the April high near 212.81, and wave ((2)) finished at 184.40 before the rally resumed. Then the market produced another extension inside wave ((3)), which strengthened the bullish cycle.
After that, we identified waves (1), (2), (3), (4), and (5) inside the extended leg. The market even formed a smaller extension inside wave (1), which reinforced the trend. This behavior highlighted why we always trade with the trend, since extensions can appear without warning.
Wave ((3)) ended at the October high, and wave ((4)) completed at the November low. From there, we expected one more high to complete wave ((5)) and finish wave I. We shifted the label from wave (V) to wave I as each correction confirmed the structure.
Wave ((5)) created a new high and formed an ending diagonal. This pattern suggested the cycle was near completion. The market then broke below the diagonal, which increased the risk of bearish acceleration. If the structure confirmed, wave II could retrace toward the 329.32–268.42 area before the bullish trend resumed.
Elliott Wave Principle Behind the Market Structure
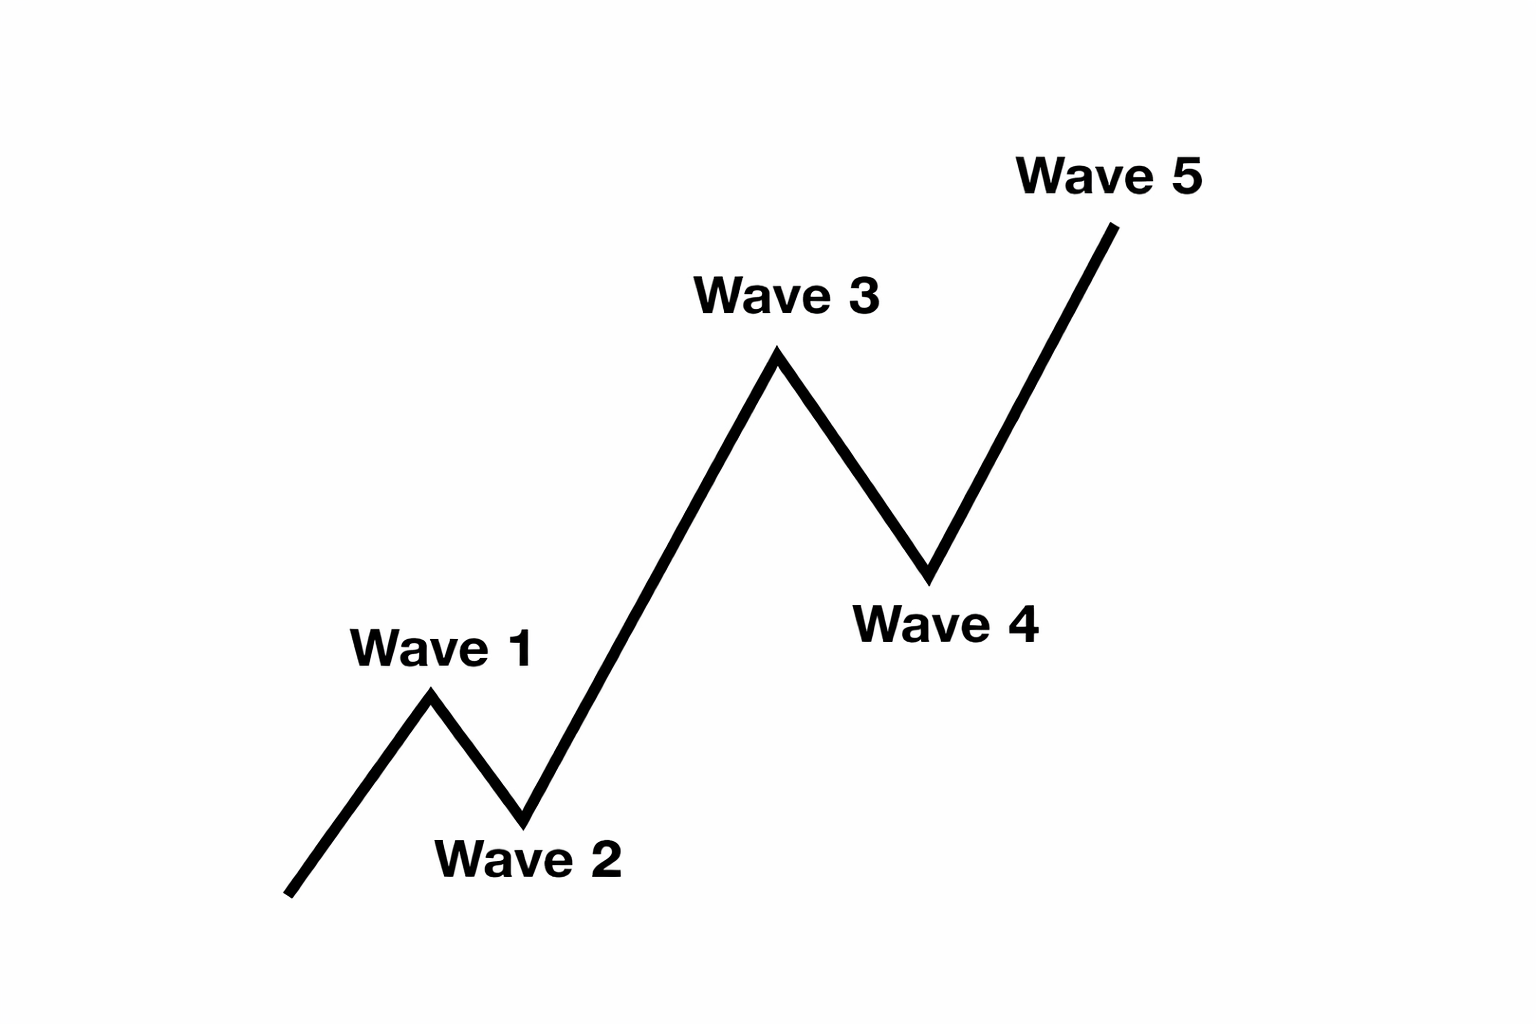
Impulse
An impulse is a clean 5‑wave pattern that drives the trend forward.
- Waves 1‑3‑5 are strong and directional.
- No overlap between waves 1 and 4.
- Wave 3 is usually the strongest.
- Structure is clear, with increasing momentum.
Wave Extensions
Extensions occur when one impulsive wave becomes significantly longer and more powerful than the others.
Most commonly, wave 3 extends, creating the longest and most explosive leg.
An extended wave subdivides into a clear, elongated 5‑wave pattern.
The other two impulsive waves remain shorter and more proportional.
Extensions highlight where the market’s strongest momentum is concentrated.

Elliott Wave Outlook: SMH Daily Chart June 13th, 2026
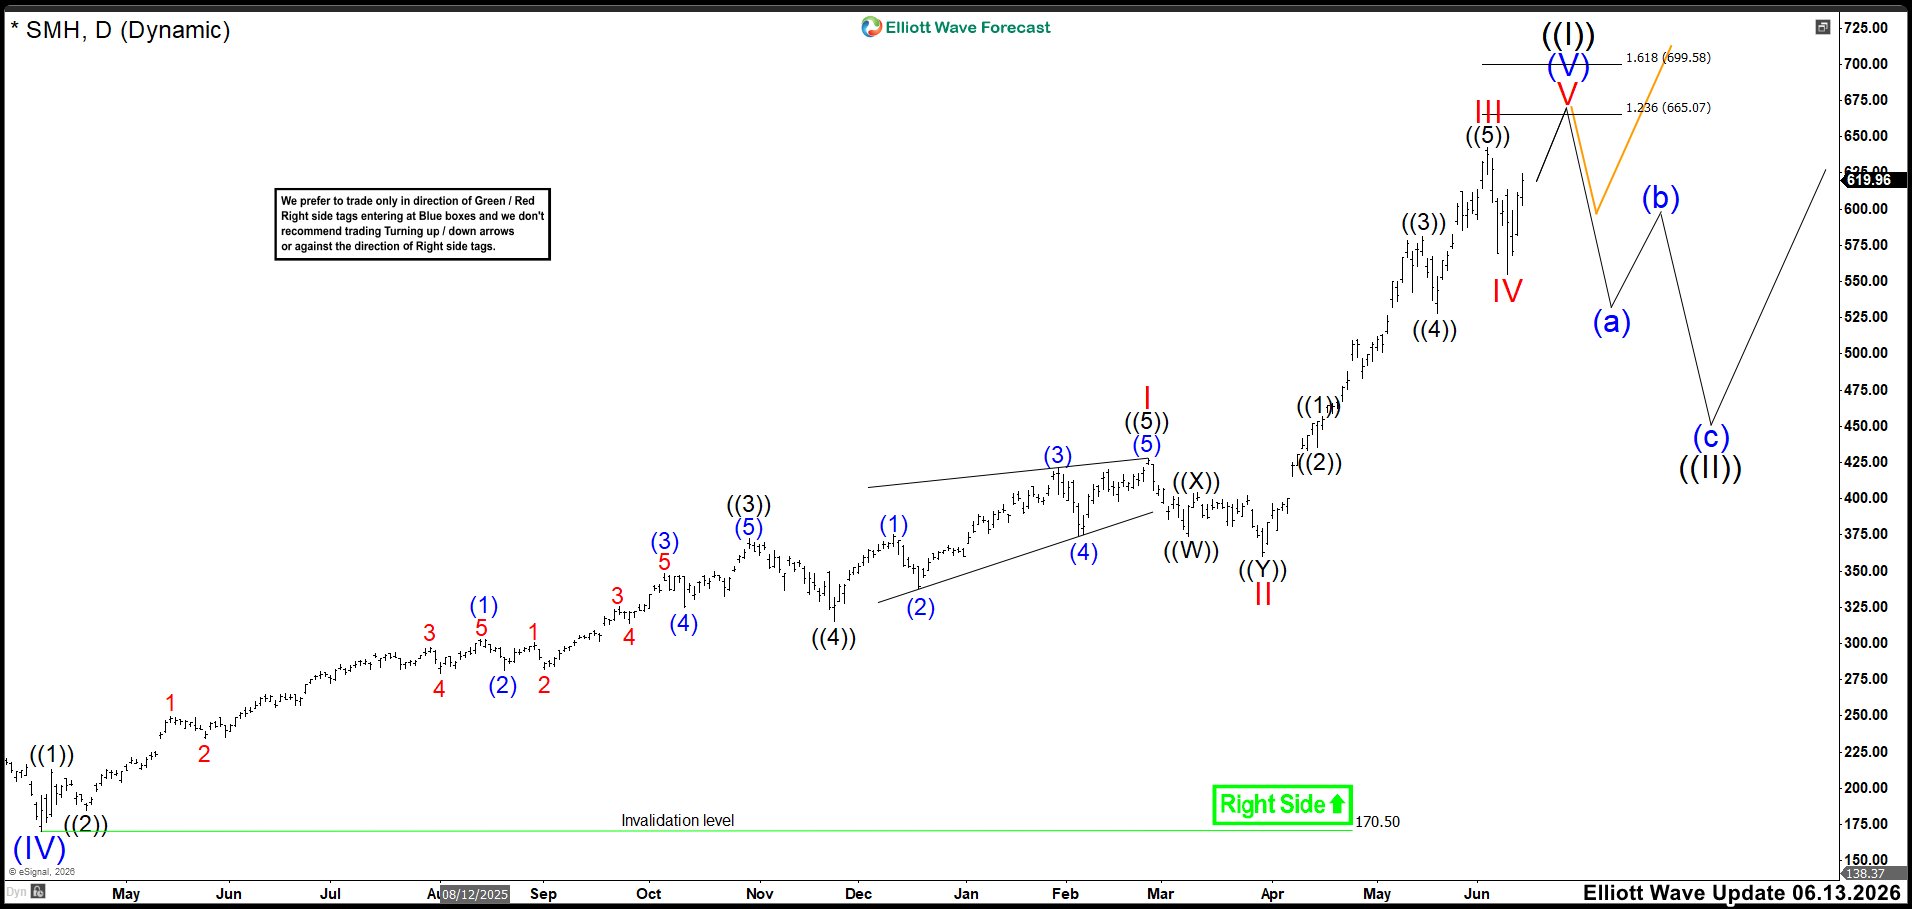
SMH completed a very strong impulsive cycle into the end of wave (III) and then developed a relatively shallow wave (IV), reflecting the exceptional bullish momentum in the market. In fact, the correction we expected in March as wave II, which should have reached at least the 329 area, never materialized. The market showed such strength that the decline was minimal, invalidating the expectation of a deeper correction typical of a higher‑degree wave II. This lack of depth confirmed that buying pressure continued to dominate and that the bullish cycle still had room to extend. From the wave (IV) low, the ETF has been advancing within wave (V), a final leg that usually shows slower acceleration and signs of exhaustion. The internal structure of the rally fits a mature fifth wave, and the natural target to complete the cycle remains the 665–700 cluster, where Fibonacci extensions and the final projection of the impulse converge.
Once wave (V) completes in that zone, the market will enter a decisive phase with two possible corrective paths. The first is the deeper scenario, shown by the black path, where the market develops a higher‑degree wave ((II)), correcting the entire cycle from the 2022 lows. This scenario would imply a more aggressive and prolonged decline. The second scenario is the orange path, where the market only corrects the cycle that began on June 9, producing a more moderate pullback in three or seven swings before resuming the bullish trend. The key to distinguishing between both outcomes will be the depth of the decline: a break below the wave (IV) low would be a clear signal that the market is entering the deeper correction of wave ((II)). As long as that level holds, the more moderate correction remains the preferred scenario.
Transform Your Trading with Elliott Wave Forecast!
Ready to take control of your trading journey? At Elliott Wave Forecast, we provide the tools you need to stay ahead in the market:
Blue Boxes: Stay ahead in the market with fresh 1-hour charts updated four times daily, daily 4-hour charts on 78 instruments, and precise Blue Box zones that highlight high-probability trade setups based on sequences and cycles.
Live Sessions: Join our daily live discussions and stay on the right side of the market.
Real-Time Guidance: Get your questions answered in our interactive chat room with expert moderators.
🔥 Special Offer: Start your journey with a 14-day trial for only $0.99. Gain access to exclusive forecasts and Blue Box trade setups. No risks, cancel anytime by reaching out to us at support@elliottwave-forecast.com.
💡 Don’t wait and get a DISCOUNT for any plan!
Click in the next link, go to Home Chat and ask for a flat discount code saying that you saw this in Luis’ Blog: 🌐


