Royal Caribbean Cruises Ltd (NYSE: RCL) is a global cruise industry leader. This article analyzes its weekly Elliott Wave structure. Our examination uncovers the current bullish path and key targets ahead of the next correction.

Elliott Wave Analysis

From its 2020 low, RCL created a three wave advance into new all time highs. Wave (I) ended at $99.24, followed by Wave (II) at $31.09, Wave (III) ended 336.5 and wave (IV) finished at $244.45. Up from there, the stock is resuming the rally in wave (V) of ((III)) and looking for new highs. Currently, the projected path shows an upside target at the inverter fib ext level $395 – 442.

Consequently, as long as price stays above the recent January 2026 low $264, then RCL will continue it’s impulsive advance . The move in wave (V) can see further extension this year beyond the mentioned target. However once wave ((III)) is in place, the stock will enter a larger degree correction in wave ((IV)) which will present another investment opportunity .

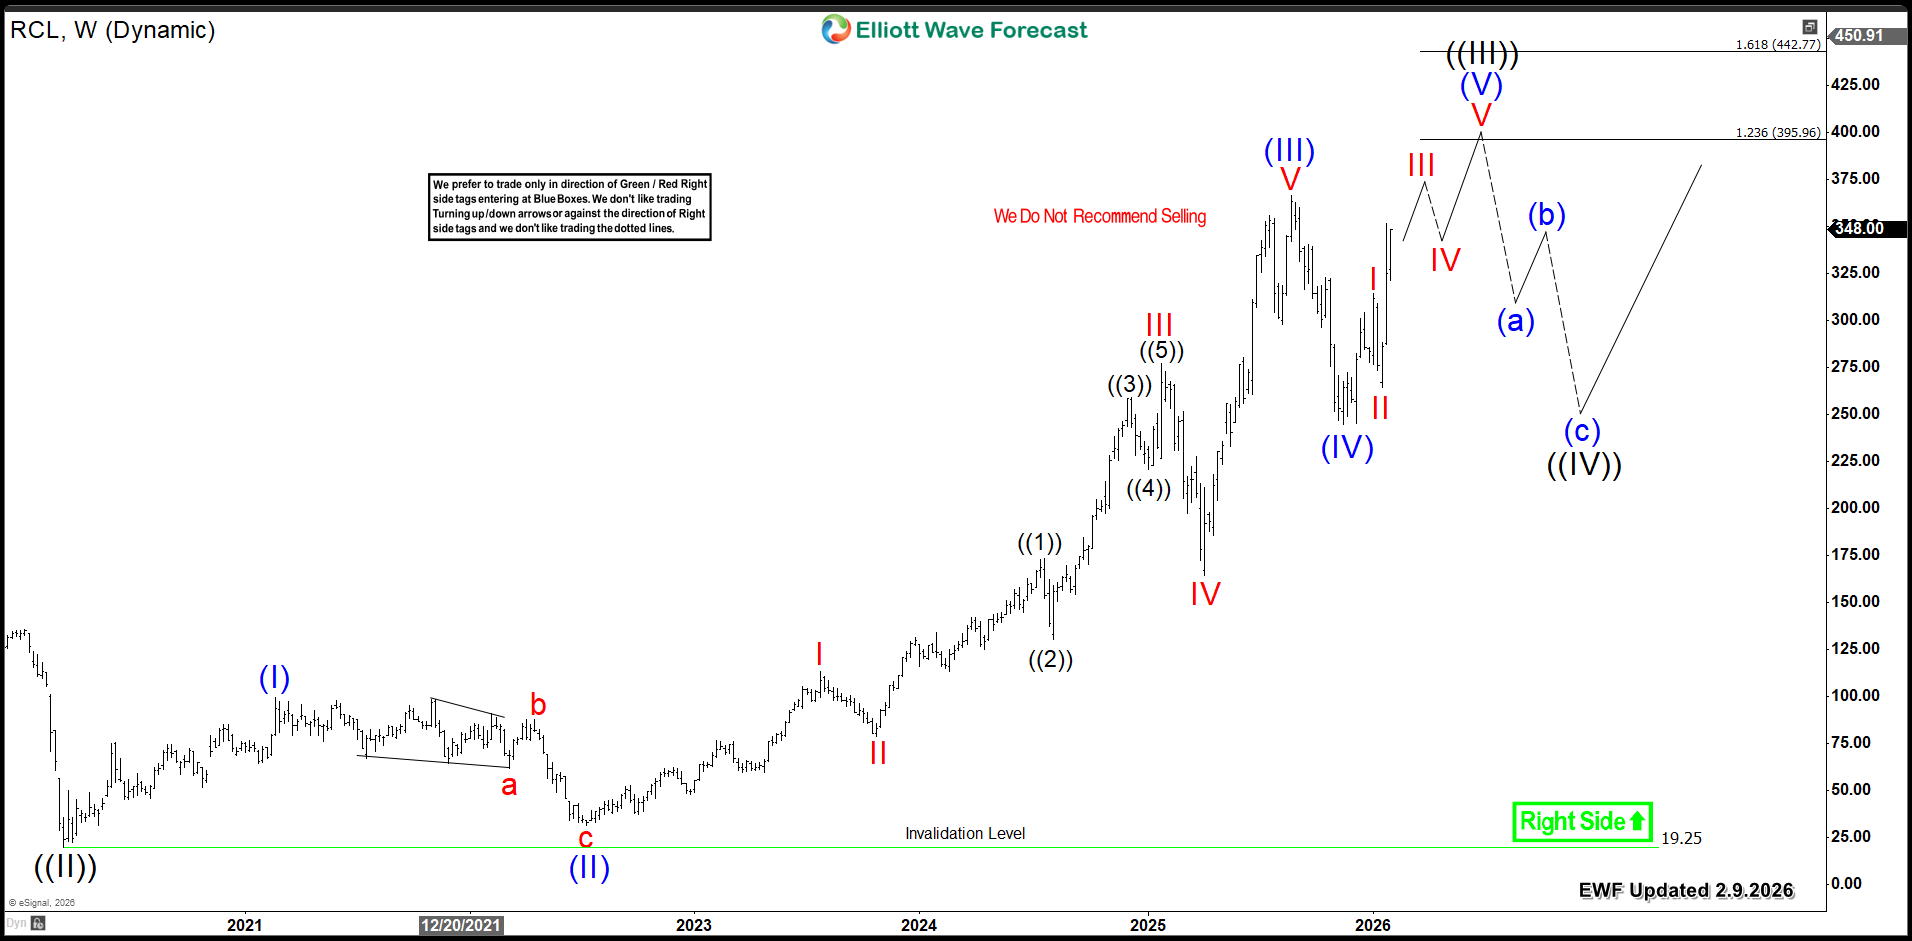
RCL Weekly Chart 2.9.2026

Royal Caribbean RCL Weekly Chart

Conclusion

RCL’s bullish cycle signals further upside ahead. Therefore, traders should target strategic entries during corrective pullbacks. Apply our Elliott Wave methodology for exact timing. More precisely, enter the market after a 3, 7, or 11-swing correction finishes. Additionally, our proprietary Blue Box system pinpoints high-probability entry zones. Consequently, this disciplined method provides clarity and confidence. Ultimately, it positions traders to capture the next major bullish leg.