

When retail traders look for ways to play the ongoing artificial intelligence supercycle, they almost universally flock to the same handful of over-analyzed mega-caps. But while the main financial headlines focus entirely on chipmakers and hyperscalers, seasoned technical analysts know that the real, institutional smart money is quietly driving a massive structural trend in the physical backbone powering AI: data center power infrastructure and advanced liquid cooling.
Enter Vertiv Holdings Co (VRT). Founded as part of Emerson Electric before going public via a SPAC merger in 2020, Vertiv has transformed from a traditional industrial supplier into an essential gatekeeper of high-density AI clusters. As next-generation GPUs push traditional air-cooling facilities past their physical limits, Vertiv’s coolant distribution units, liquid-to-air systems, and recent tactical acquisitions—like European heat-exchange leader ThermoKey—have positioned the company at the epicenter of AI thermal architecture.
The Powerhouse Fundamentals Driving the Tape
What makes Vertiv an elite asset for technical analysis is that its chart is backed by immense, undisputed institutional accumulation. This isn’t a speculative meme stock; it is an operational powerhouse. Vertiv’s fundamental metrics reveal exactly why large funds are aggressively defending its structural trend:
- Explosive Top-Line Growth: Vertiv reported a staggering 30.1% year-over-year revenue increase to $2.65 billion in Q1 2026, primarily fueled by a massive 53% surge in its Americas segment.
- The Unprecedented $15 Billion Backlog: The company sits on an immense $15 billion order backlog, which guarantees strong revenue visibility extending all the way into 2027.
- Surging Profitability & Guidance: Vertiv’s high-margin product mix expansion drove an adjusted operating margin expansion of 430 basis points to 20.8%. Following this performance, management raised full-year 2026 revenue guidance to a range between $13.5 billion and $14.0 billion, forecasting an annual EPS growth of over 50% year-over-year ($6.30 to $6.40 per share).
- Investment-Grade Blueprint: Solidified by inaugural investment-grade credit ratings from Moody’s and S&P in early 2026, Vertiv maintains a fortified balance sheet with an adjusted free cash flow that recently surged 147% to $653 million.
This heavy, predictable flow of institutional capital acts as a filter, stripping away the erratic retail “noise” that plagues larger tech names. The result is a clean, mathematically precise Elliott Wave structure that provides one of the highest-probability setups on our radar this quarter.
The Macro Perspective: A Textbook Motive Cycle
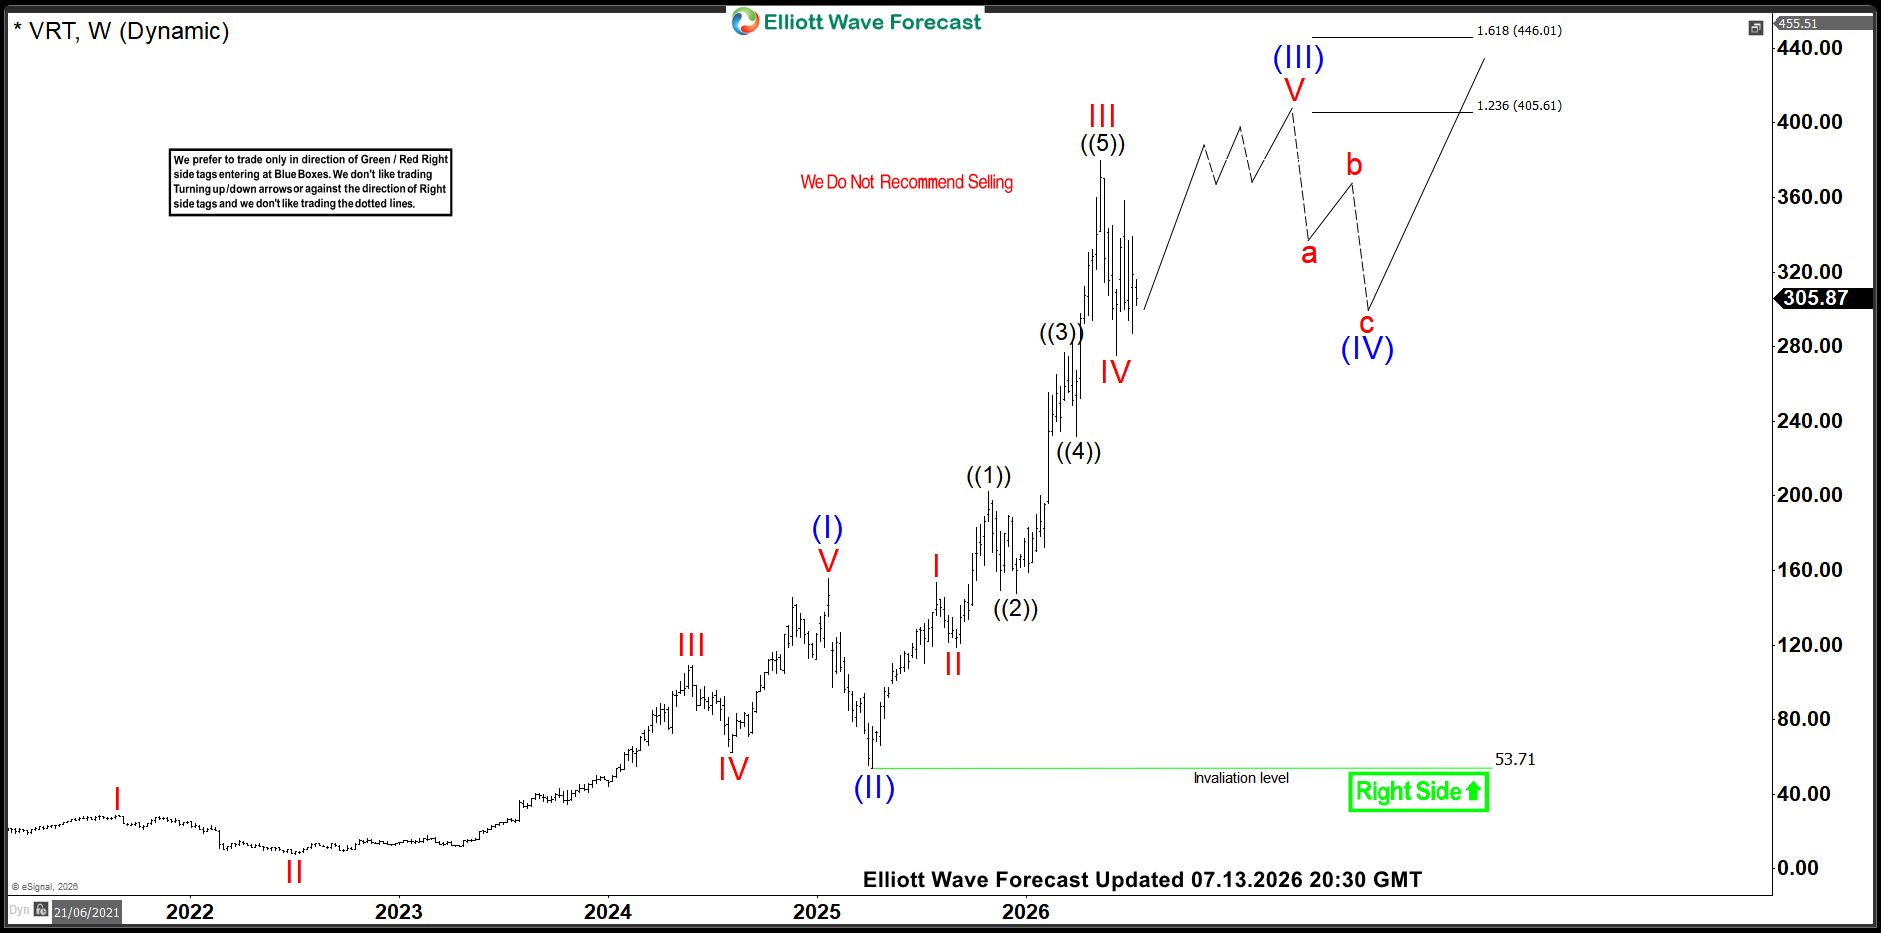
From an Elliott Wave perspective, VRT is a beautifully geometric example of a trending market. On the daily chart, the stock is currently progressing through a powerful, higher-degree Cycle Wave (III) impulsive advance.
Vertiv (VRT) Macro Structure:
[Super Cycle Wave (I)] ➔ [Super Cycle Wave (II) (Deep Retracement)] ➔ [Super Cycle Wave (III) (Current Extension)]
└── Currently finished cycle degree wave IV
What makes VRT a standout instrument right now is the sheer cleanliness of the structure since April 2025 low labelled as wave (II) on the chart shown below. We can see clear 7 swings up from this low which calls for 1 more high to complete a motive cycle since April 2025 low. Rather than forming messy, sideways, overlapping complex structures, VRT’s recent corrective breathers have repeatedly respected precise Fibonacci retracement levels. The market is currently wrapping up a Cycle degree wave IV pull back which might have ended back in June 2026 with a test of 38.2% Fibonacci retracement of Cycle degree wave III — a classic, healthy pause that absorbs overbought momentum before the next major bullish extension takes flight.
The Technical Execution: Wave IV Targets and Invalidation
The short-term path forward for Vertiv is defined by a clear, highly actionable structural boundary. As long as the recent structural swing low at $275.18 remains unbroken, our primary wave count remains firmly bullish looking for new highs.
[Wave IV Swing Low: $275.18] ➔ 🚀 [Wave V Target Zone: $405.61 to $446.01]
We anticipate further strength out of this corrective base toward new all-time highs which could take the form of a clean impulse or a diagonal structure. This bullish expansion is projected to target the $405.61 to $446.01 price band. This zone represents the inverse 123.6% to 161.8% Fibonacci extension area measured from the Wave IV pullback, providing an ideal mathematical exhaustion zone for the unfolding Wave V cycle.
⚠️ The Alternate View: A Shift in Cycle Degree
No technical analysis is complete without a solid backup plan. If the $275.18 structural floor fails to hold, it will break the immediate bullish sequence and trigger a larger corrective cycle.
[$275.18 Breaks] ➔ 📉 [Incomplete Bearish Sequence] ➔ [Target Zone: $252.78 to $187.15]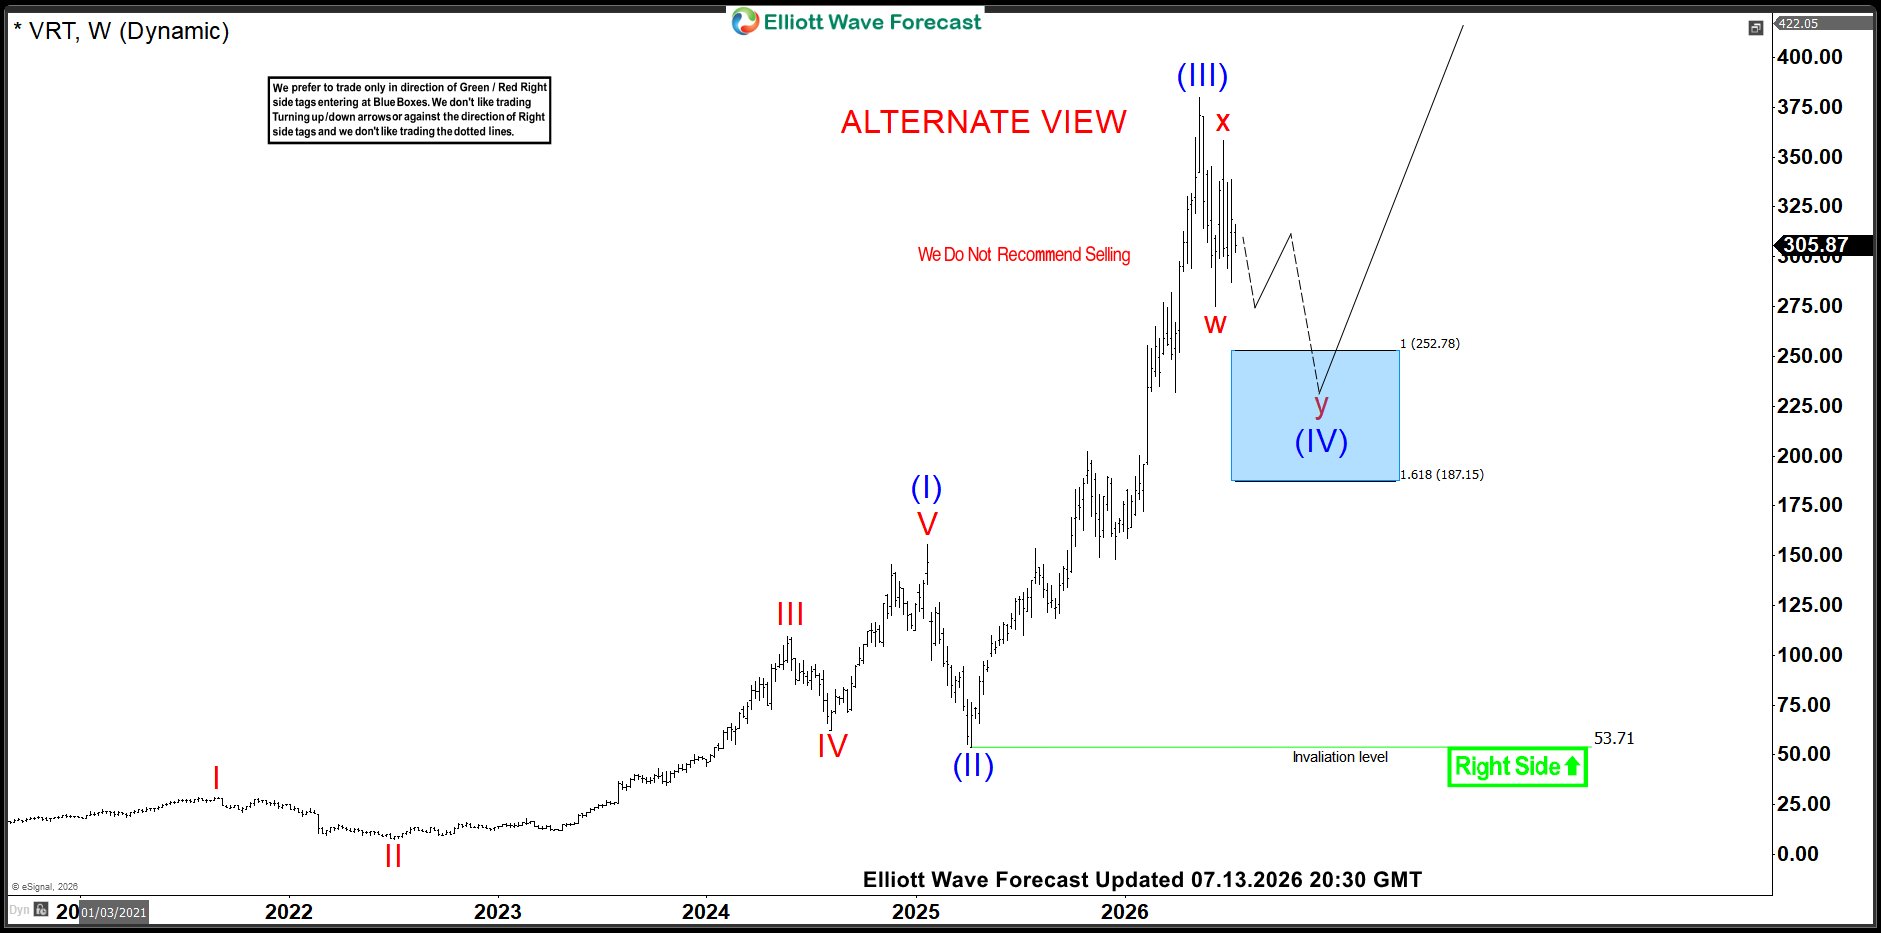
Key Elements of the Alternative view:
- Incomplete Bearish Sequence: Breaking the pivot confirms a bearish sequence originating from the May 11, 2026 peak. This opens the door for a deeper correction into the 100% to 161.8% Fibonacci extension area.
- The Downside Targets: This extended sell-off points to a broad structural target zone between $252.78 and $187.15.
- A Shift to Super Cycle Degree: A drop of this magnitude would be too large to qualify as a standard Cycle Degree Wave IV. Instead, the chart would upgrade the pattern to a larger Super Cycle Wave (IV) pullback, acting as a multi-month correction of the entire bull market launched from the April 2025 low.
The Final Blueprint: Key Blog Takeaways
- The Bullish Trigger: While above $275.18, primary upside targets remain to be in the range of $405.61 to $446.01.
- The Primary Line in the Sand: Keep a close eye on $275.18. As long as price remains above this swing low, the primary bullish outlook remains fully valid.
- The Deeper Correction Invalidation Level: A decisive break below $275.18 shifts the bias in the mid-term. This structural breakdown voids the aggressive upside targets and opens up a deeper corrective path toward $252.78 to $187.15.
- Risk Mitigation: This is not financial advice. Always use proper position sizing to capitalize on a high-momentum Wave V extension while keeping potential losses small if the Super Cycle alternative plays out.


