Hello fellow traders. In this technical article we’re going to look at the Elliott Wave charts of AMD Stock published in members area of the website. As our followers know, the stock is trading within the cycle from the 75.21 low. Recently, we forecasted the end of the short-term pull back (B) in blue and called for a further rally in the stock. In the following text, we’ll explain the Elliott Wave analysis and present target areas.
AMD Elliott Wave 1 Hour Chart 04.21.2025
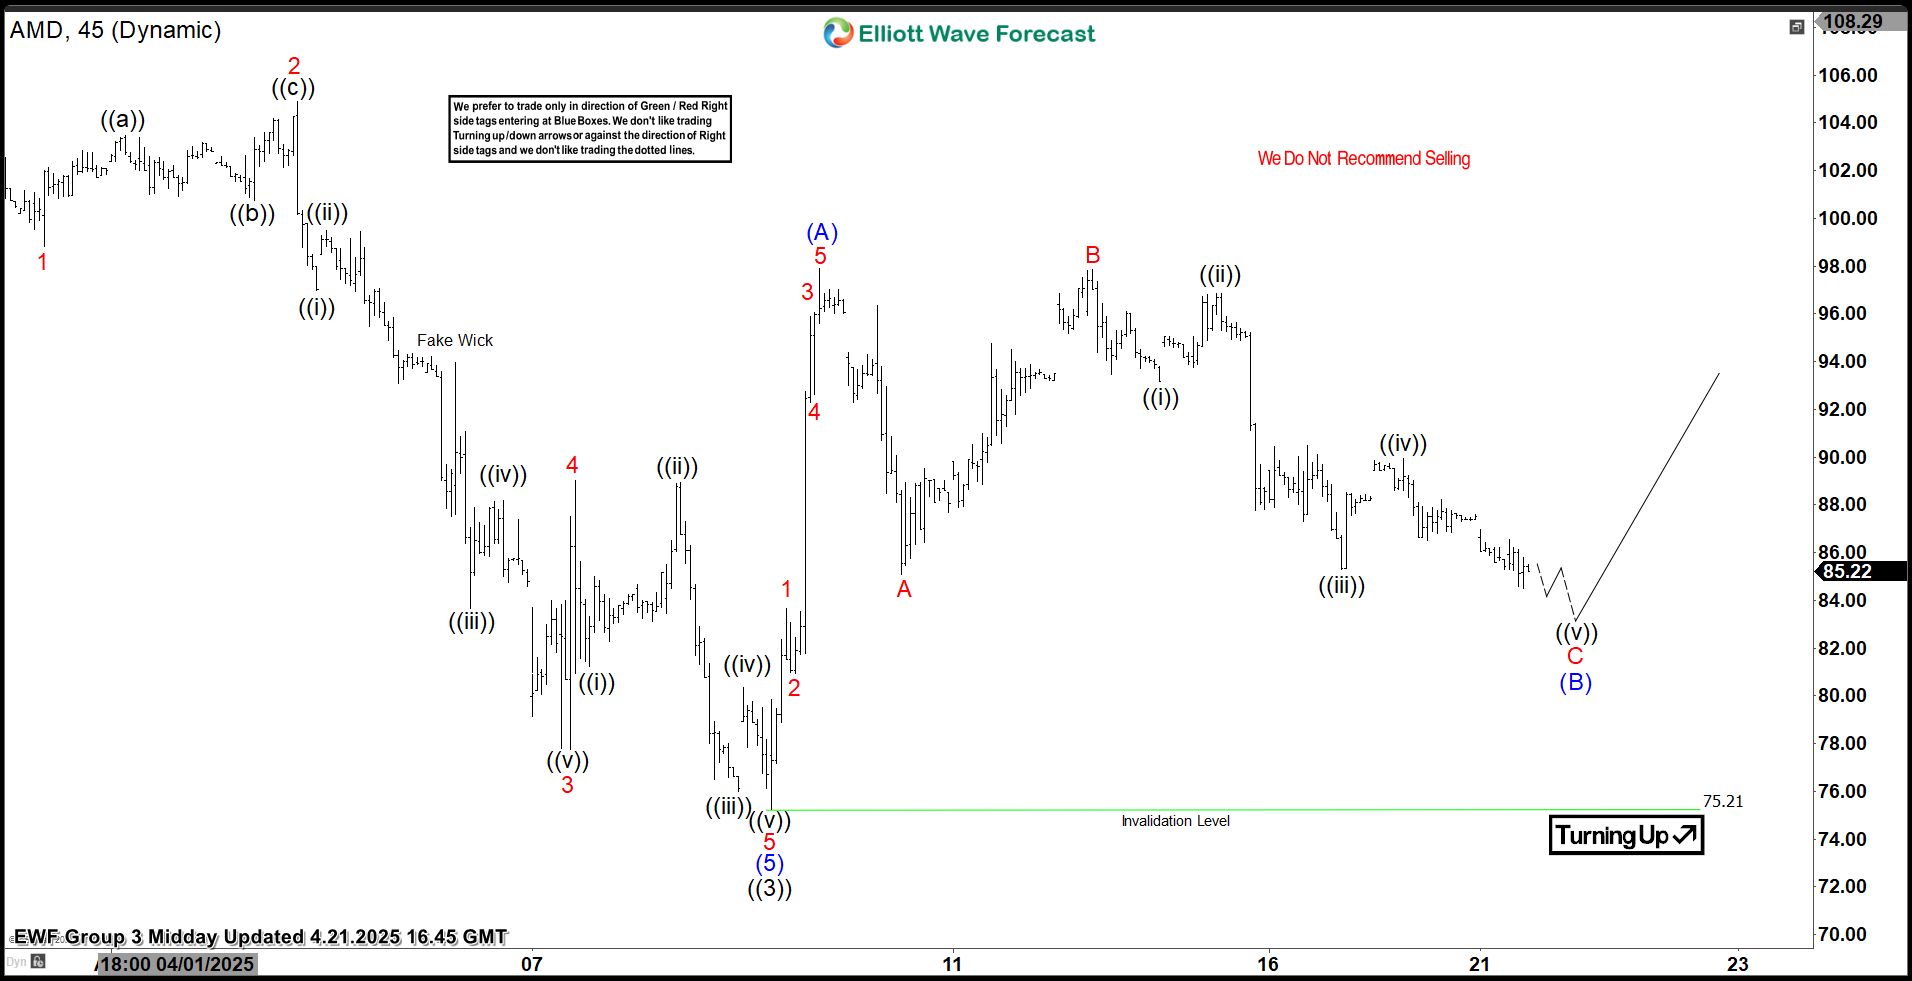
AMD stock is showing a three-wave pullback against the 75.21 low. The correction already displays enough swings, and we expect it to complete at any moment. Our members know that in such cases we can easily identify the reversal area by measuring the Equal Legs zone (A related to B), which comes in at the 85.0–82.0 area. We expect buyers to appear within the mentioned zone and to see a further rally in the stock from there.
90% of traders fail because they don’t understand market patterns. Are you in the top 10%? Test yourself with this advanced Elliott Wave Test
AMD Elliott Wave 1 Hour Chart 04.28.2025
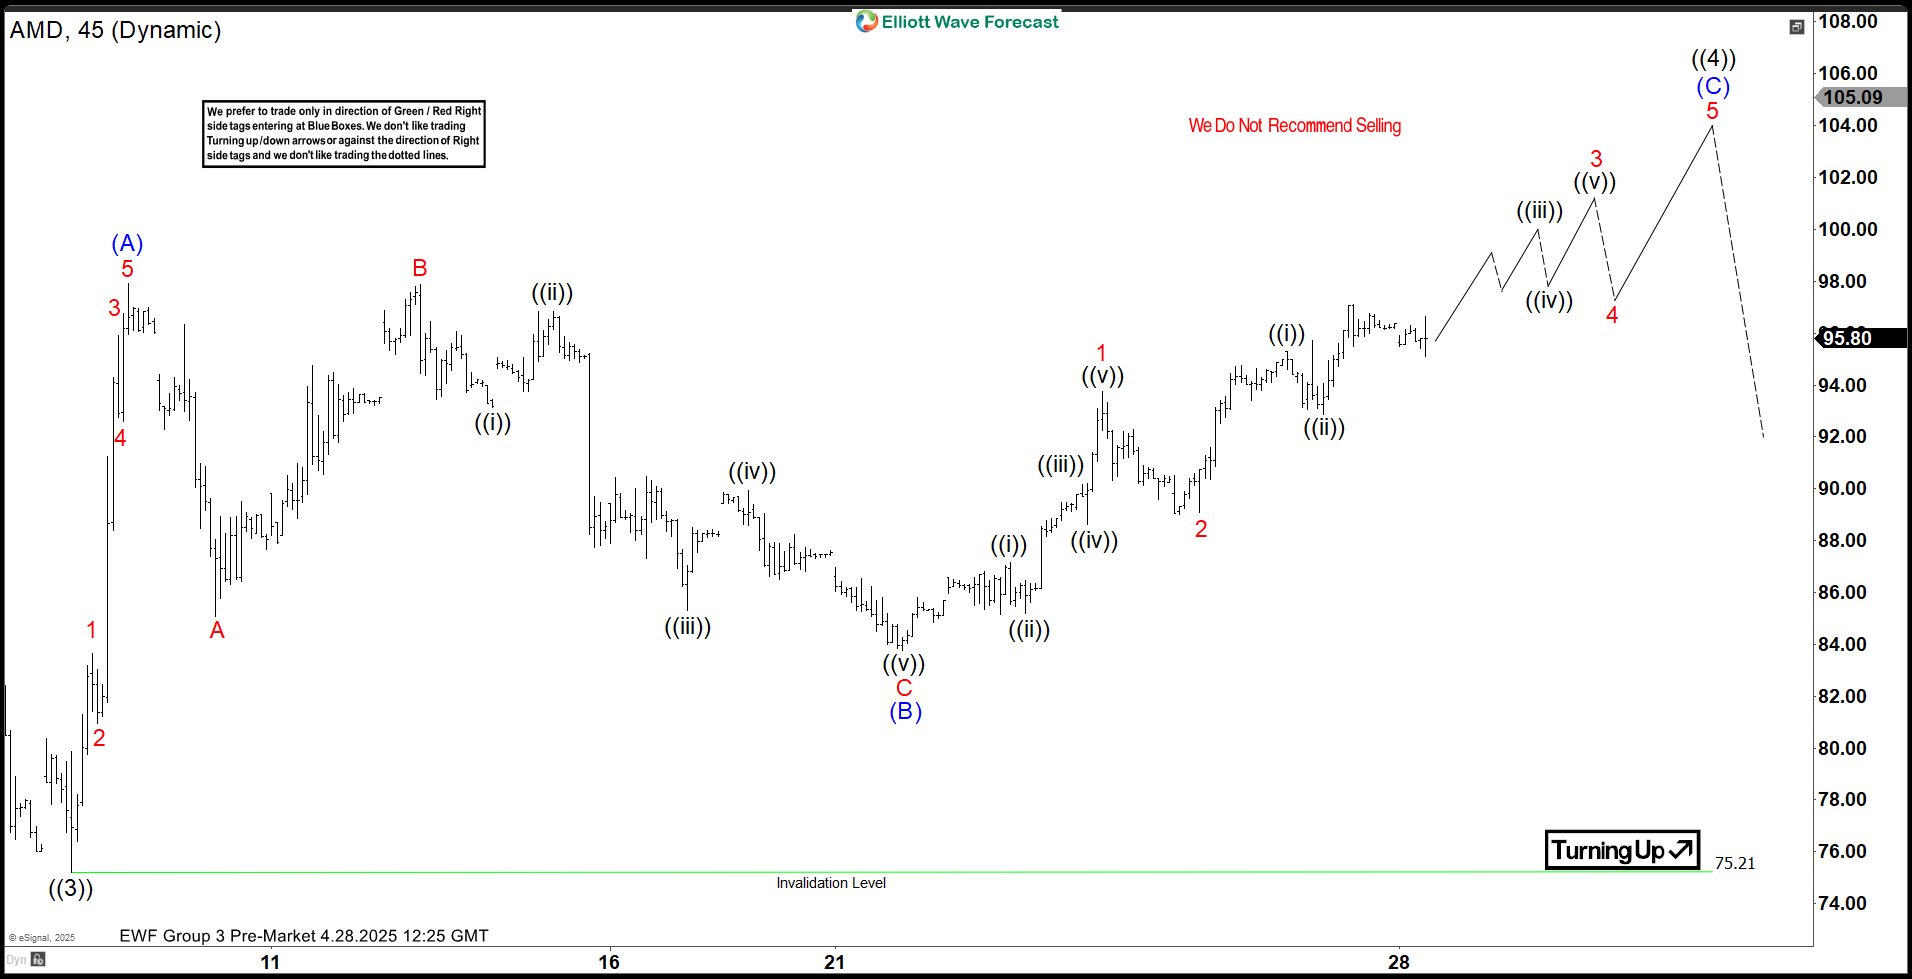
AMD found buyers as expected at the Equal Legs area (85.0–82.0) and has delivered a decent rally so far. Now, we would like to see a break above the April 9th peak to confirm further extension to the upside toward the 105.82+ zone.
Remember, the market is dynamic, and the presented view may have changed in the meantime. For the most recent charts and target levels, please refer to the membership area of the site. The best instruments to trade are those with incomplete bullish or bearish swing sequences. We put them in Sequence Report and best among them are presented in the Live Trading Room
Reminder for members: Our chat rooms in the membership area are available 24 hours a day, providing expert insights on market trends and Elliott Wave analysis. Don’t hesitate to reach out with any questions about the market, Elliott Wave patterns, or technical analysis. We’re here to help.
📈 How well do you really know the stock market? Take this Stock Market Quiz and put your knowledge to the test!