

The Elliott Wave Theory has existed for nearly a century. Its core principle remains powerful: financial markets move in recognizable patterns driven by collective psychology. However, markets, technology, and the way traders receive information have changed dramatically.
At Elliott Wave Forecast, we believe the theory must be applied to today’s markets—not the markets of the 1930s. This is what makes our approach different.
We respect the original Elliott Wave principles, but we do not apply them as a rigid academic exercise. Our objective is not simply to label every wave correctly. Our objective is to identify the most probable market path, determine the right side of the market, and locate areas where traders can enter with clearly defined risk.
Moving Beyond Traditional Elliott Wave Analysis
Traditional Elliott Wave analysis often focuses heavily on finding a perfect five-wave impulse followed by a three-wave correction. While these structures remain important, modern financial markets frequently develop more complex patterns.
Markets are now influenced by algorithmic trading, high-frequency systems, global capital flows, exchange-traded funds, options activity, and nearly instantaneous access to information. These forces can create extended corrections, double and triple combinations, irregular structures, and powerful correlations across different asset classes.
As a result, rigidly forcing every market move into a simple five-wave pattern can lead to incorrect conclusions.
Our methodology recognizes that corrective structures can unfold in 3, 7, or 11 swings. We analyze these sequences to determine whether a move is corrective or impulsive and whether the larger cycle remains incomplete.
This allows us to concentrate on the market’s structure instead of reacting emotionally to every short-term move.
Structure Comes Before News
Financial news usually explains a market move after it has already happened. By the time the explanation reaches the public, the market may already be approaching its next turning point.
Our approach begins with structure. We study the sequence of swings, the larger market cycle, momentum, timing, and relationships between instruments. This helps us develop a directional view before the news becomes part of the narrative.
This does not mean that news is irrelevant. Economic reports, central-bank decisions, earnings, and geopolitical events can produce volatility. However, we believe these events often act as catalysts within a structure that is already developing.
The structure gives us the roadmap. The news may provide the acceleration.
Why We Use High-Frequency Areas
One of the most important elements of our methodology is the identification of High-Frequency trading areas, which our members know as Blue Boxes. A Blue Box is a calculated price area where a corrective sequence is expected to complete. These areas are based on relationships between the swings, including Fibonacci extensions, the number of swings within the correction, and the direction of the larger market cycle.
We commonly identify these opportunities when the market develops a 3-, 7-, or 11-swing corrective structure against the prevailing trend. For example, when the larger trend is bullish, we wait for a corrective decline to reach a Blue Box. Rather than chasing the market after it has already rallied, the Blue Box allows traders to prepare for a potential entry at a more favorable price.
When the larger trend is bearish, the same principle can be applied in reverse. We wait for a corrective rally into a Blue Box where sellers may return. The purpose of the Blue Box is not to predict the exact price of a market turn. Its purpose is to define an area where the structure, price relationships, and larger directional view come together.
Trading an Area Instead of a Perfect Price
Markets rarely turn at the exact price expected by every trader. Attempting to identify one perfect entry can result in missed opportunities or poorly managed risk. That is why we work with an area rather than a single price.
Inside a Blue Box, traders can use a planned entry strategy while defining the level that would invalidate the setup. If the market responds from the area, the position can be managed according to the developing structure. If the market breaks through the invalidation level, the trader knows that the original idea requires reassessment.
The Blue Box therefore provides three essential elements:
A defined trading area
A clear directional expectation
A measurable level of risk
Blue Boxes are not guarantees. No analytical method can eliminate risk. Their value comes from creating a consistent and repeatable process based on structure rather than emotion.
Blue Box Examples: Before and After
The best way to understand the value of a Blue Box is to see the complete process—from the original forecast to the market’s reaction.
The following examples show charts published before the move occurred alongside updated charts after price reached the Blue Box. They demonstrate how we identify corrective sequences, establish the expected path, and define the area where buyers or sellers are expected to appear.
Example 1: Buying Opportunity
Instrument: XAGUSD 04.05.2025
Original forecast:
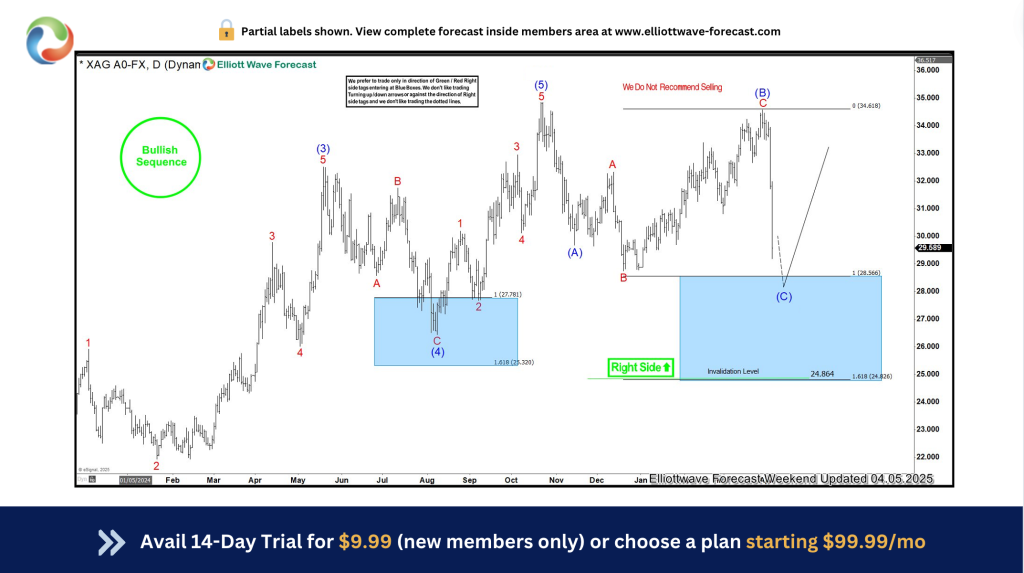
Chart explanation:
Silver was doing a clear ABC pullback with a define buying area.
Market reaction:
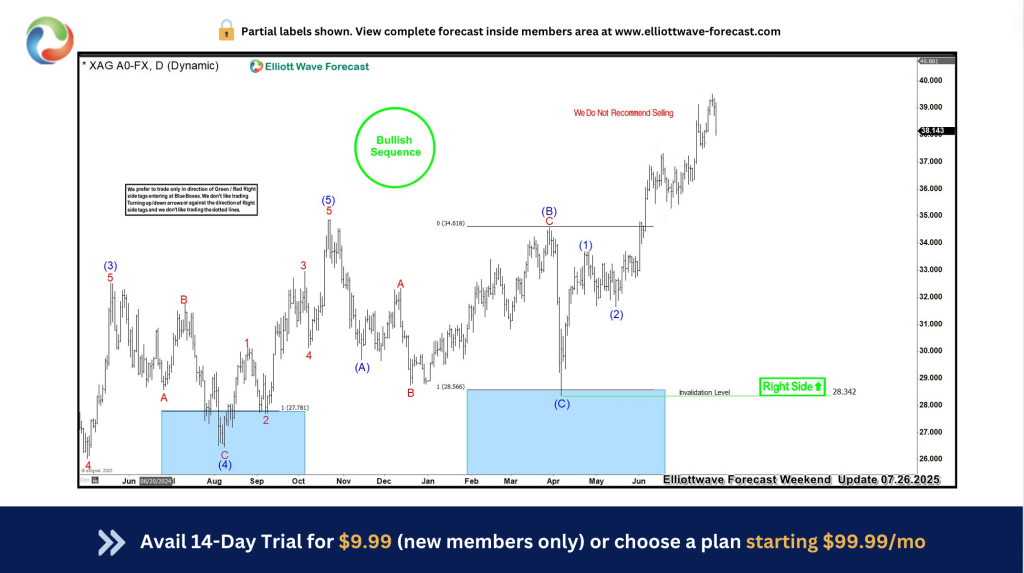
Result:
Silver reached the Blue Box (High-Frquency) area and stared a rally that took the Metal over $100.00
Example 3: Blue Box Within a Correlated Market View
Instrument: SPX Daily View
Original forecast:
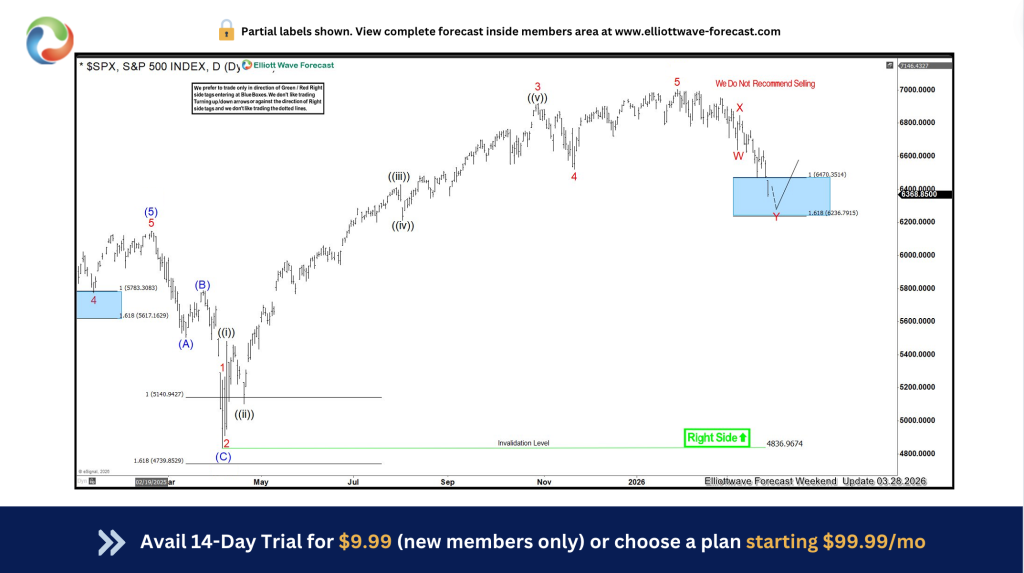
Chart explanation:
The Index ended the cycle since 04.07.2025 and corrected in 7 swings into the buying area.
Market reaction:
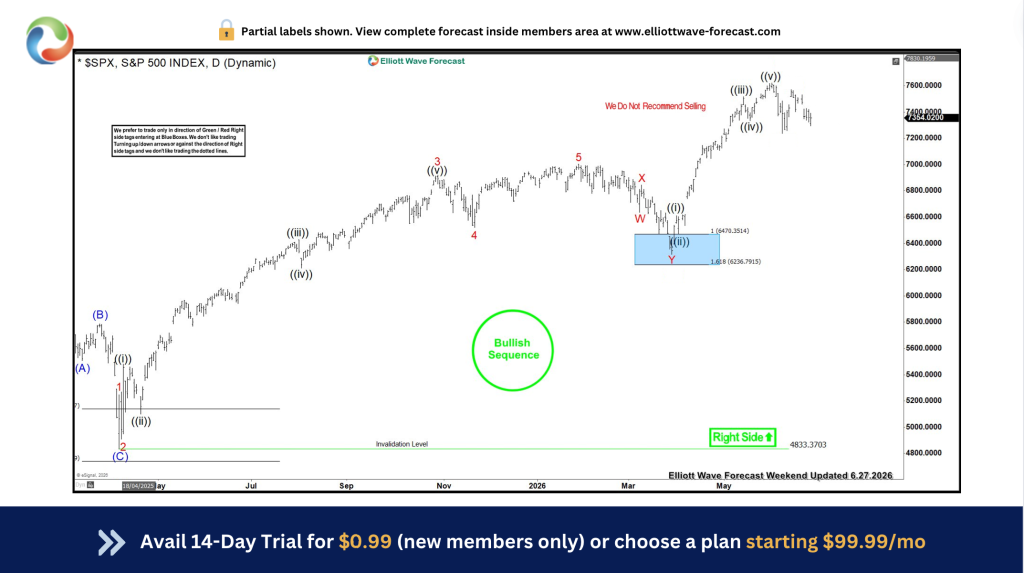
Result:
The Index reached the Blue Box (High-Frequency) area and traded into new All time highs.
These before-and-after examples demonstrate the practical purpose of our methodology. The objective is not to describe a move after it happens. It is to identify the expected path in advance, wait for the market to reach the High-Frequency area, and approach the opportunity with clearly defined risk.
The Importance of the Right Side
One of our primary objectives is to determine the right side of the market. The right side represents the direction supported by the larger cycle and the incomplete sequence. Once that direction has been established, we look for corrections against it rather than attempting to trade every movement in both directions.
This is an important distinction. A trader does not need to capture every market fluctuation. The goal is to identify the clearest structural opportunity and wait for the market to reach the area where the risk-to-reward relationship becomes favorable. This is why buying or selling the 3-, 7-, or 11-swing correction remains central to our methodology.
Using Market Correlations for Confirmation
Modern markets are deeply interconnected. Indices, currencies, commodities, bonds, and individual stocks frequently influence or confirm one another. We do not analyze an instrument in isolation.
A potential move in the U.S. Dollar may affect metals and currency pairs. Bond-market behavior can provide information about interest-rate expectations. Major technology stocks may confirm or challenge the expected direction of the broader indices.
By reviewing many instruments across multiple asset classes and time frames, we can identify common structural themes. When several related markets support the same conclusion, the analysis becomes stronger. When they disagree, we know additional caution may be required.
This broader perspective is another important difference between our methodology and a traditional single-chart wave count.
Adapting Elliott Wave Theory to Modern Technology
Technology has changed what is possible in market analysis. Today, we can monitor hundreds of instruments, compare structures across multiple time frames, calculate price relationships quickly, update charts continuously, and distribute information to members around the world in real time.
At Elliott Wave Forecast, technology allows us to make the methodology more practical and consistent. It helps us recognize developing sequences, compare correlated markets, update invalidation levels, and communicate changes as the market evolves. However, technology does not replace analysis. It supports it.
Markets remain dynamic, and no software can remove uncertainty. Human interpretation is still necessary to understand context, recognize alternative structures, and determine which scenario best fits the available evidence.
The strongest approach combines the principles of Elliott Wave Theory with modern tools, extensive market coverage, and disciplined risk management.
Analysis Must Evolve With the Market
Adapting does not mean abandoning the Elliott Wave Theory. It means preserving its most valuable principles while applying them in a way that reflects how modern markets actually behave.
Our approach is built around:
Identifying impulsive and corrective sequences
Recognizing 3-, 7-, and 11-swing structures
Determining the right side of the market
Using correlations across global instruments
Locating High-Frequency areas through Blue Boxes
Defining risk before entering a trade
Updating the analysis as market structure changes
The market does not reward analysts for producing the most complicated wave count. It rewards traders who can remain patient, manage risk, and act when structure presents a clear opportunity.
The Elliott Wave Forecast Difference
What makes Elliott Wave Forecast different is not simply the number of charts we produce or the number of markets we cover. The difference is how we transform Elliott Wave Theory into a practical trading framework.
We do not analyze markets solely to describe what has already happened. We use structure to establish an expected path, identify the right side, and prepare for the next opportunity.
The Blue Boxes bring that philosophy together. They help traders avoid chasing price, wait for corrective structures to mature, and approach the market with a defined plan.
Markets will continue to evolve, and technology will continue to change the trading environment. Our responsibility is to evolve with them while remaining faithful to the principles that make Elliott Wave analysis valuable.
The theory provides the foundation. Technology expands our capabilities. Structure gives us the direction. The Blue Boxes define the opportunity.
Conclusion
Elliott Wave Theory remains one of the most powerful methods for understanding market behavior, but its application must evolve with modern financial markets. At Elliott Wave Forecast, we combine the theory’s core principles with technology, market correlations, and a practical understanding of 3-, 7-, and 11-swing corrective sequences.
Our goal is not to create the most complicated wave count or explain a move after it has already happened. Our goal is to identify the right side of the market, establish the expected path, and prepare our members before the opportunity develops.
The Blue Boxes are an essential part of that process. They identify High-Frequency areas where a corrective sequence may complete and where buyers or sellers are expected to appear. The before-and-after examples demonstrate how these areas help transform market analysis into a structured trading plan with a defined entry zone and measurable risk.
No methodology can guarantee a market outcome. However, a consistent process can help traders avoid emotional decisions, stop chasing price, and approach each opportunity with patience and discipline.
The Elliott Wave Theory provides the foundation. Technology helps us adapt it to today’s markets. Correlations strengthen our analysis. The Blue Boxes identify the opportunity.
That combination is what makes Elliott Wave Forecast different.




