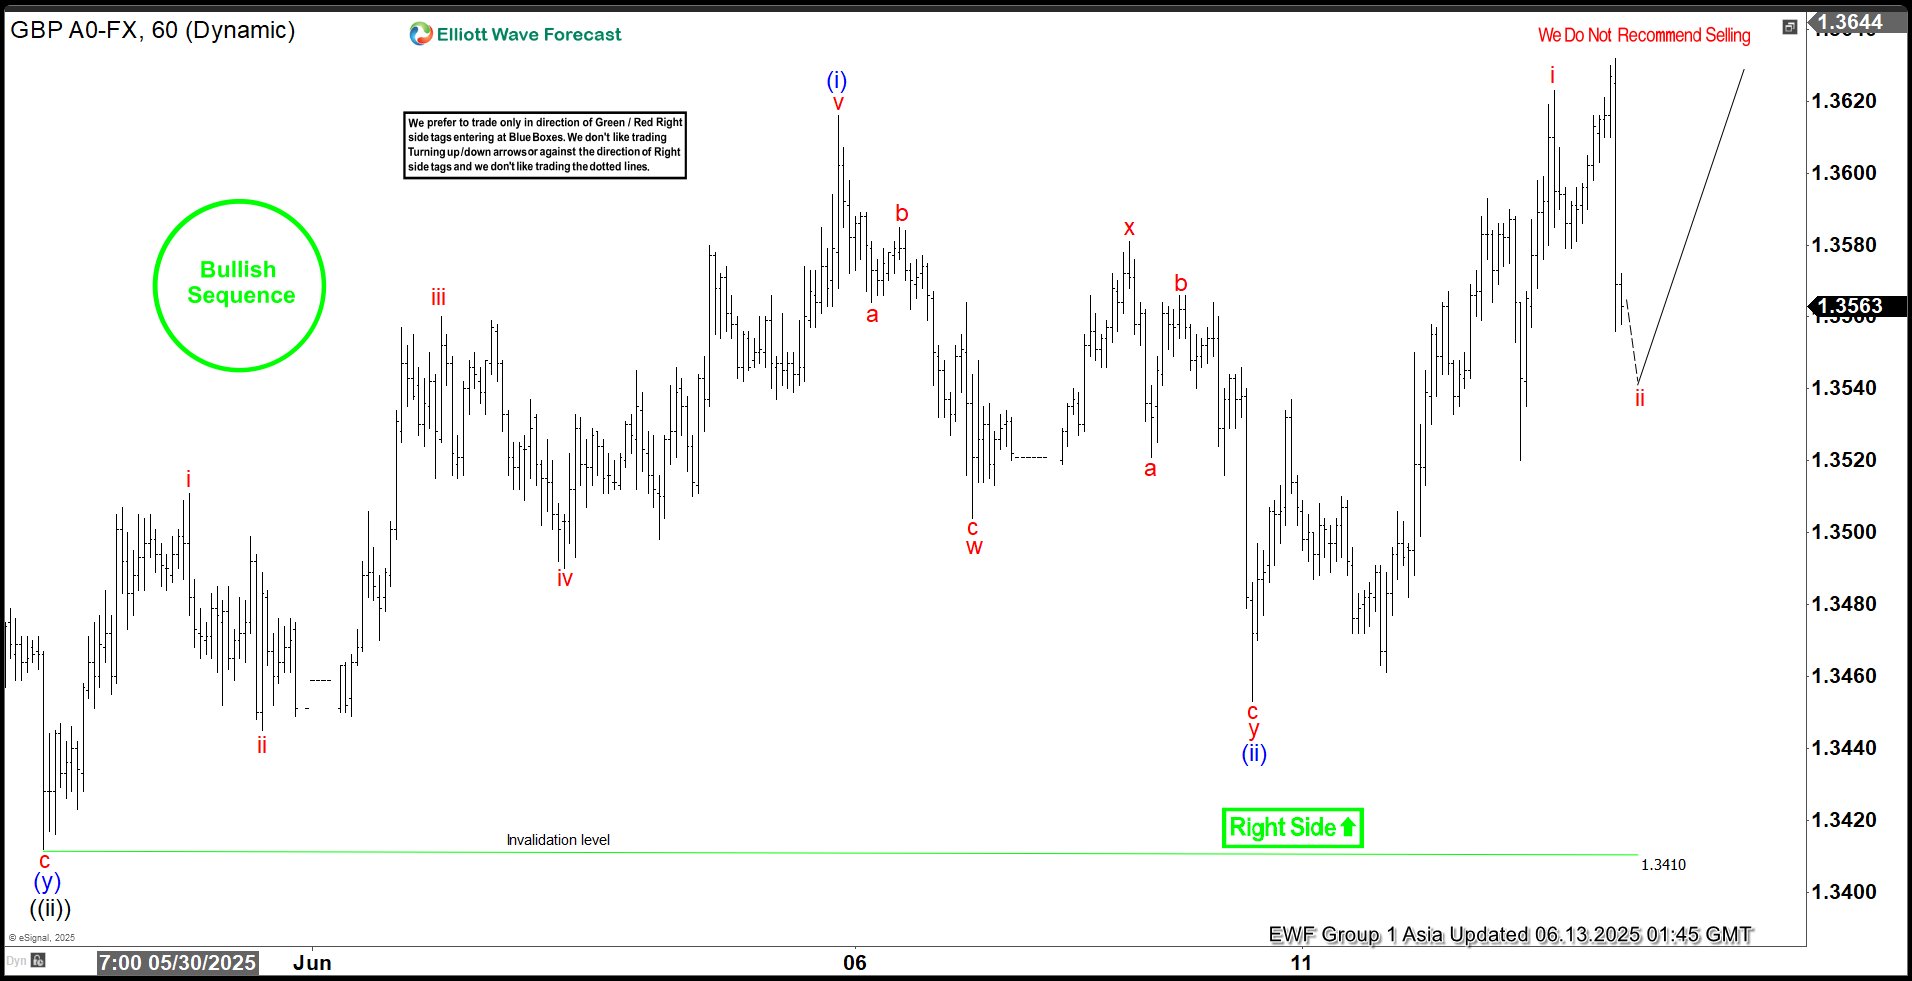
Hello fellow traders. In this technical article we’re going to take a look at the Elliott Wave charts charts of GBPUSD Forex pair published in members area of the website. As our members know GBPUSD is bullish against the 1.3410 pivot in first degree. Recently the pair made a clear three-wave correction. The pull back completed as Elliott Wave Double Three pattern and made rally as expected.
In this discussion, we’ll break down the Elliott Wave pattern and forecast.
Elliott Wave Double Three Pattern
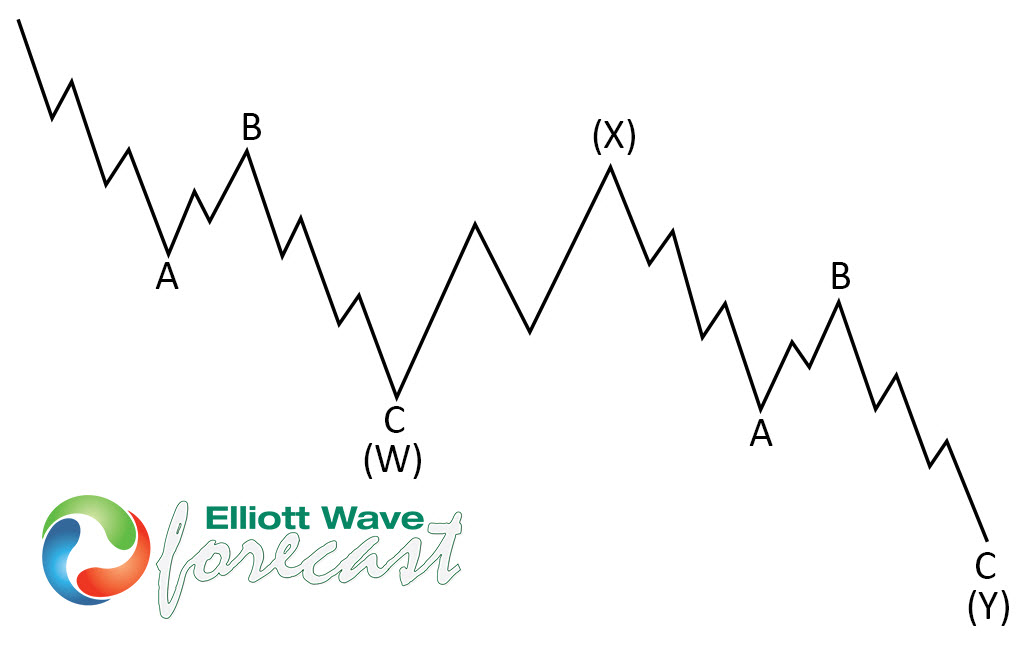
Double three is the common pattern in the market , also known as 7 swing structure. It’s a reliable pattern which is giving us good trading entries with clearly defined invalidation levels.
The picture below presents what Elliott Wave Double Three pattern looks like. It has (W),(X),(Y) labeling and 3,3,3 inner structure, which means all of these 3 legs are corrective sequences. Each (W) and (Y) are made of 3 swings , they’re having A,B,C structure in lower degree, or alternatively they can have W,X,Y labeling.
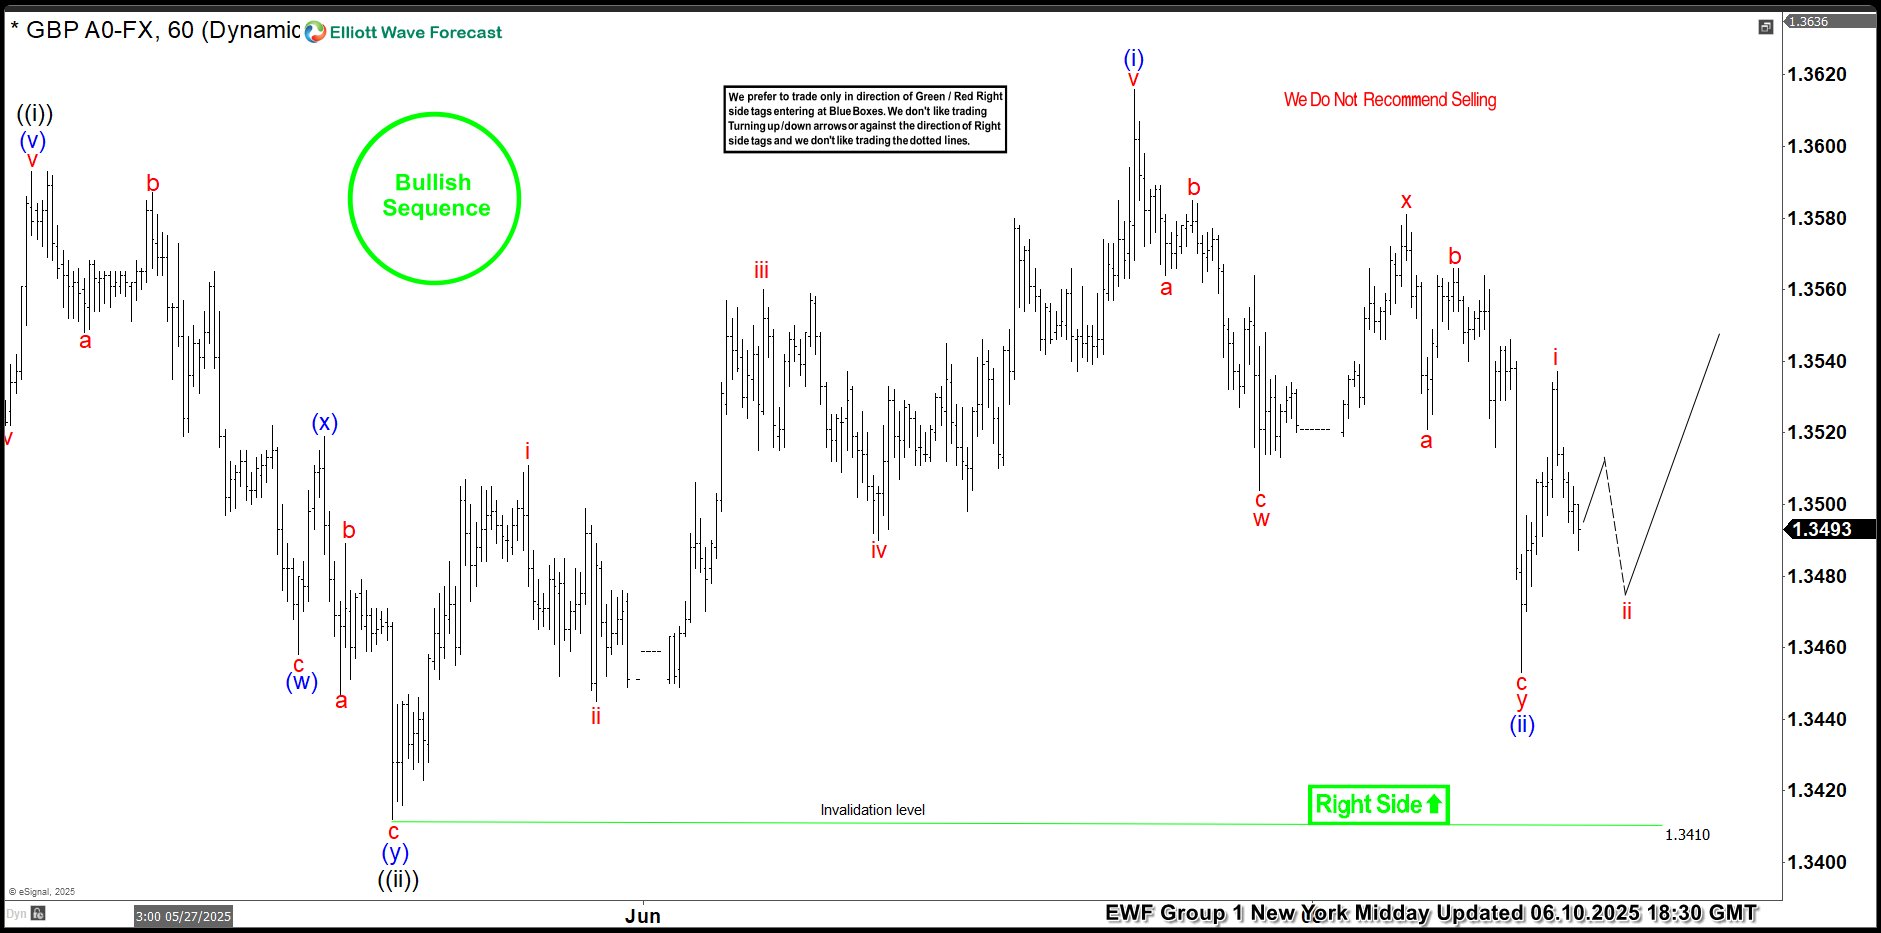
GBPUSD Elliott Wave 1 Hour Chart 06.10.2025
GBPUSD is showing higher high sequences in the cycle from the April 8th low , suggesting further strength ahead. The structure of the latest pullback shows 7 swings – Double Three Pattern. The first leg, shows a clear 3-wave structure a,b,c red, followed by a 3-wave bounce in x . We can also count 3 swings in y red leg. We advise against selling $GBPUSD and instead favor the long side. While the price stays above (ii) blue and more importantly above ((ii)) black low, we expect to see further rally toward new highs.
Did you know ? 90% of traders fail because they don’t understand market patterns. Are you in the top 10%? Test yourself with this advanced Elliott Wave Test
Official trading strategy on How to trade 3, 7, or 11 swing and equal leg is explained in details in Educational Video, available for members viewing inside the membership area.
GBPUSD Elliott Wave 1 Hour Chart 06.10.2025
GBPUSD found buyers as expected. The forex pair has reacted strongly and eventually we got a break toward new highs. Now, intraday pull backs should ideally keep finding buyers as far as 1.341 pivot holds.
Keep in mind that market is dynamic and presented view could have changed in the mean time. You can check most recent charts with target levels in the membership area of the site. Best instruments to trade are those having incomplete bullish or bearish swings sequences. We put them in Sequence Report and best among them are shown in the Live Trading Room