Hello fellow traders. In this technical article we’re going to take a quick look at the Elliott Wave charts of OIL , published in members area of the website. As our members are aware, OIL is now potentially forming irregular Flat pattern against the 55.25 low. Recently we saw a clear 3-wave pullback, followed by the expected rally and then sharp drop again. Since Israel and Iran confirmed a ceasefire, oil prices have erased all the gains made since the start of the conflict. In this post, we will explain the Elliott Wave count in detail.
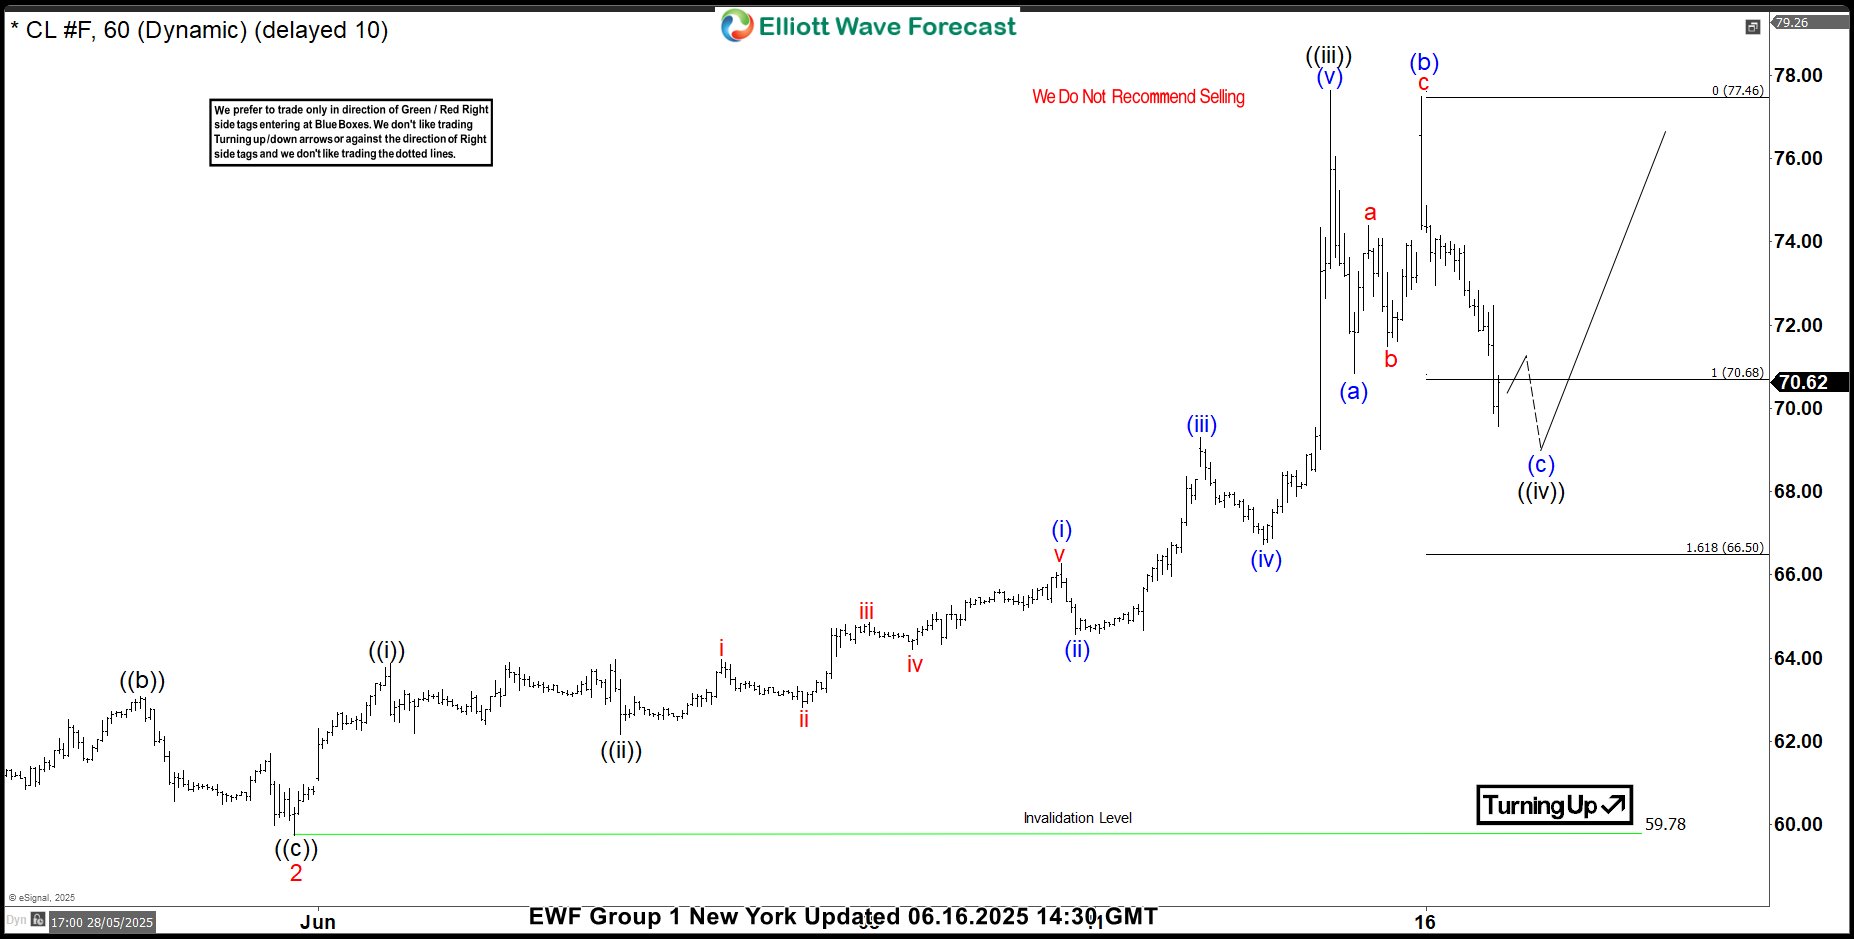
OIL 1-Hour Chart Analysis: 06.16.2025
The current view suggests that OIL is about to complete a 3-wave pullback from the peak, labeled as wave ((iv)) in black. The price has already reached the extreme zone at 70.68–66.50, from which we can expect at least one more push higher before another pullback.
We expect OIL to continue attracting intraday buyers in 3, 7, and 11 swings, as long as the price remains above the 66.50 level (1.618 Fibonacci extension).
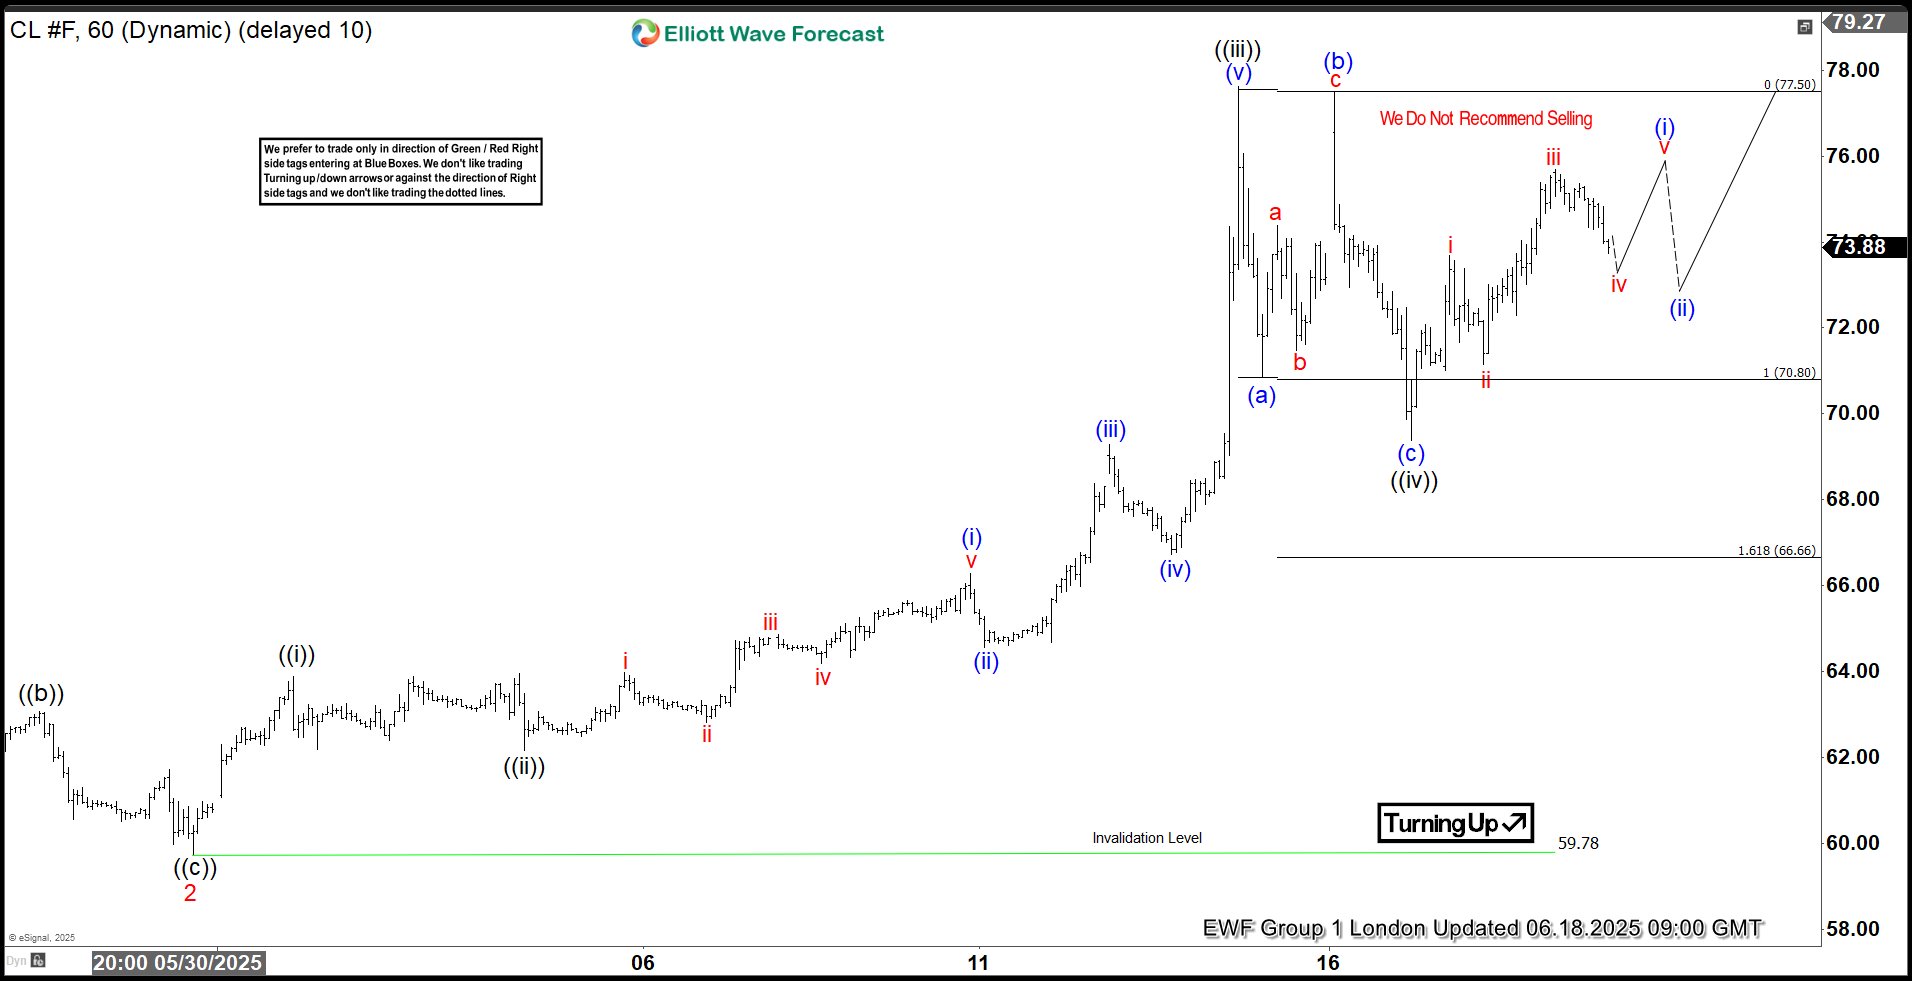
OIL 1-Hour Chart Analysis: 06.18.2025
OIL found buyers as expected and turned higher from the marked equal legs area (buyers’ zone). Wave ((iv)) ended at the 67.92 low, and we are now looking for a break above the wave ((iii)) peak. As our members know, the first target for wave ((v)) typically comes at the inverse 1.236–1.618 Fibonacci extension, which in this case lies in the 78.08–81.23 region.
Although OIL has the potential for further bullish continuation, we should be mindful of this zone, as it represents a strong technical area from which a deeper pullback may occur.
90% of traders fail because they don’t understand market patterns. Are you in the top 10%? Test yourself with this advanced Elliott Wave Test
OIL 1-Hour Chart Analysis: 06.24.2025
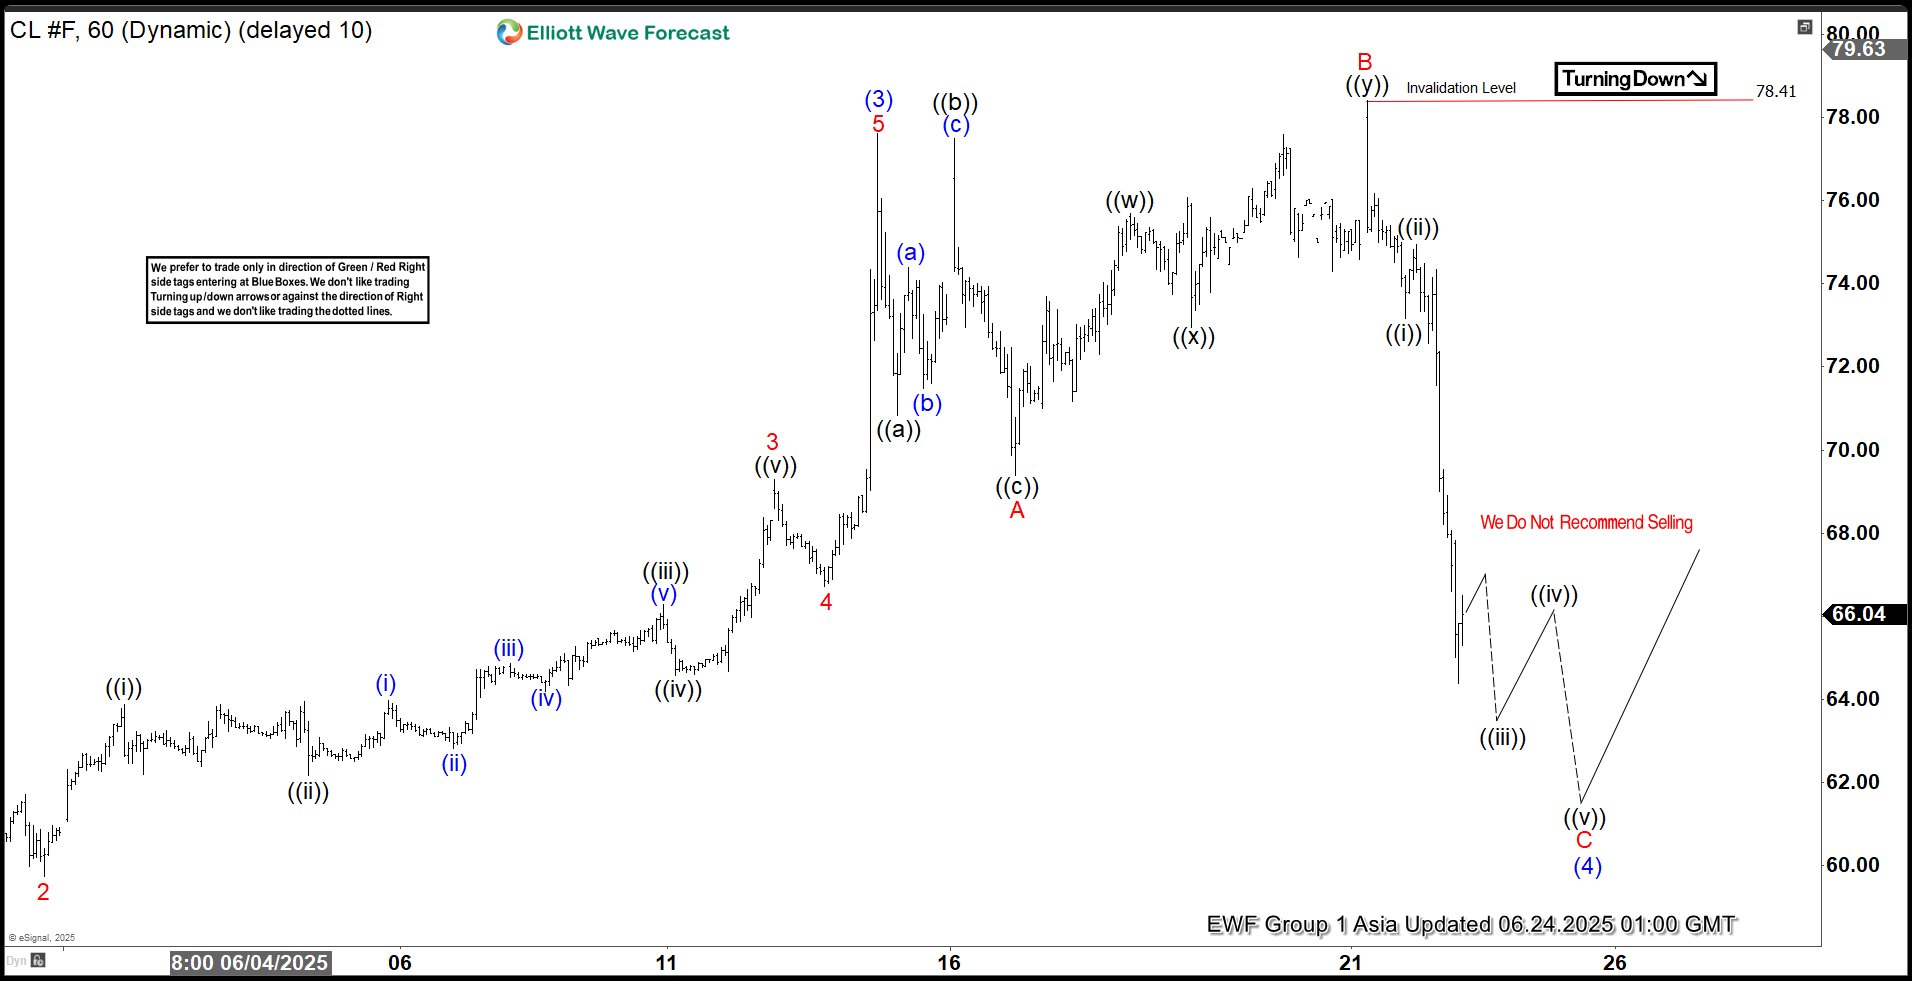
OIL made a strong reaction from the inverse 1.236–1.618 Fibonacci extension zone. The decline appears to be unfolding as an impulsive 5-wave pattern, which is still in progress. The current view suggests that wave (4) in blue is taking the form of an Irregular Flat pattern. As it stands, we are still likely missing at least one more leg down to complete the 5-wave structure in the final leg of the proposed Flat. Once wave (4) completes, we expect to see a further rally in the commodity, ideally breaking above the 78.41 peak.
Reminder for members: Keep in mind that market is dynamic and presented view could have changed in the mean time. Our chat rooms in the membership area are available 24 hours a day, providing expert insights on market trends and Elliott Wave analysis. Don’t hesitate to reach out with any questions about the market, Elliott Wave patterns, or technical analysis. We’re here to help.