
-
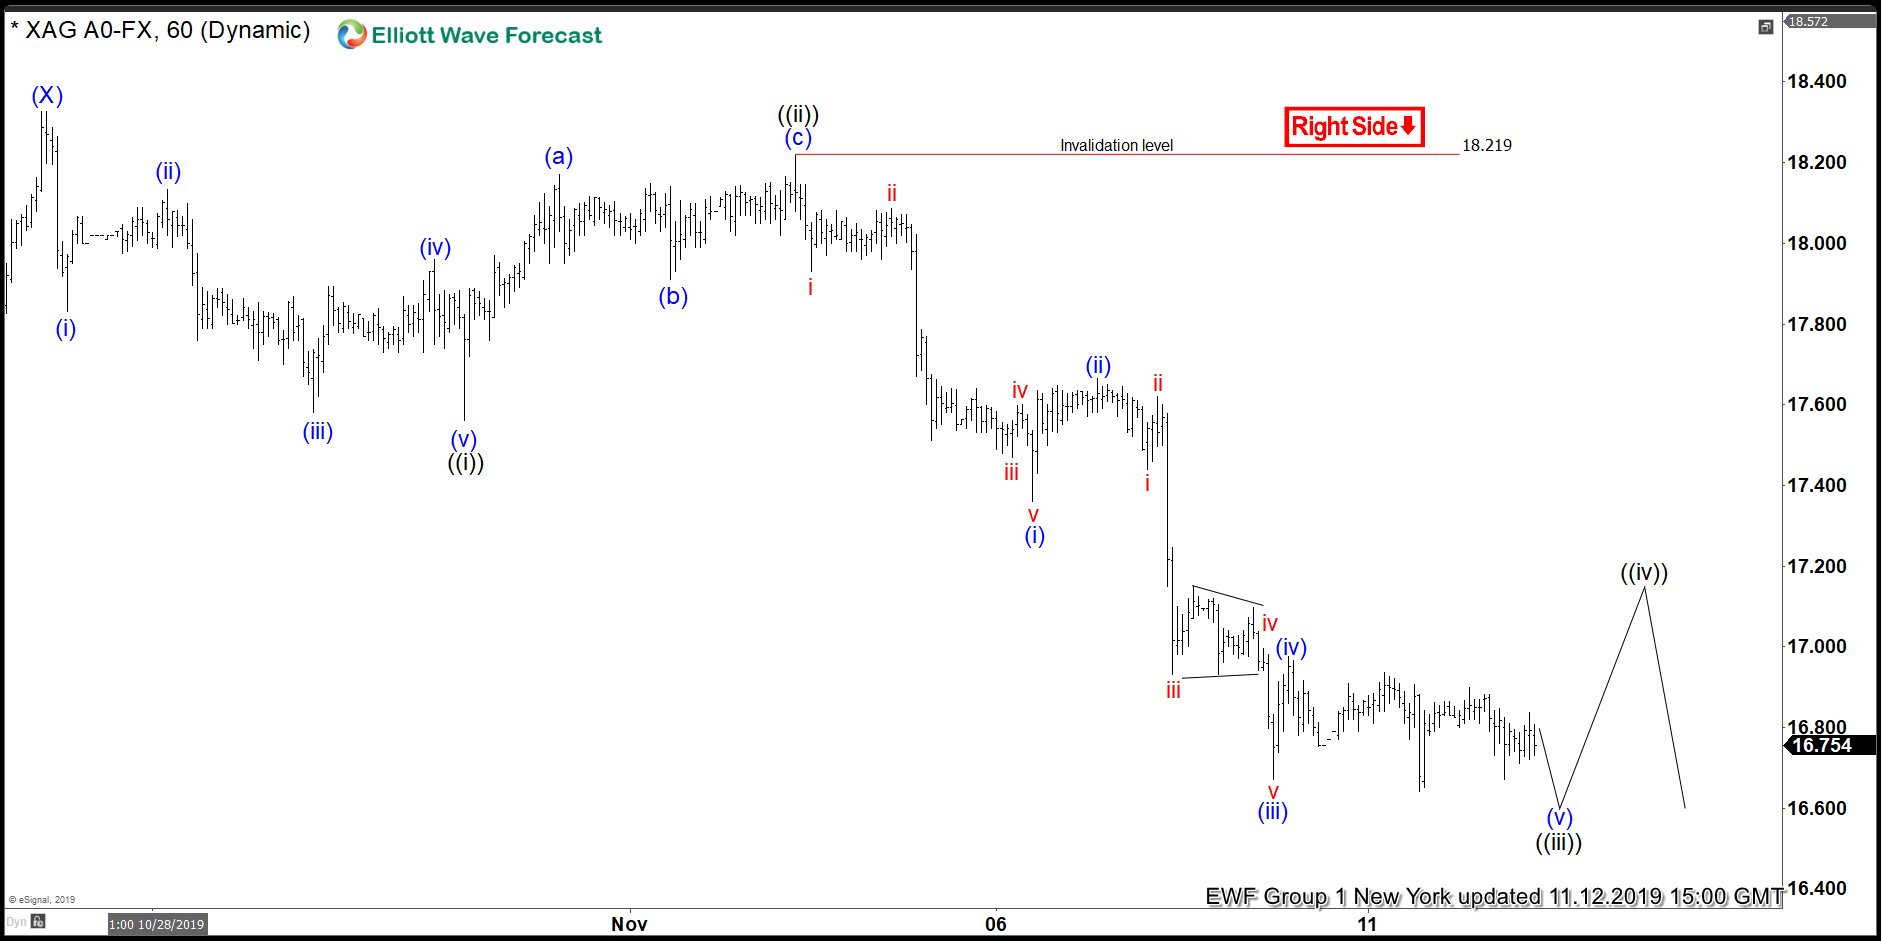
Silver Elliott Wave View: Incomplete Sequence Calling More Downside
Read MoreSilver is showing 5 swings incomplete sequence from 9/04/2019 peak ( $19.64) favoring more weakness. This article and video show the next Elliott Wave path.
-
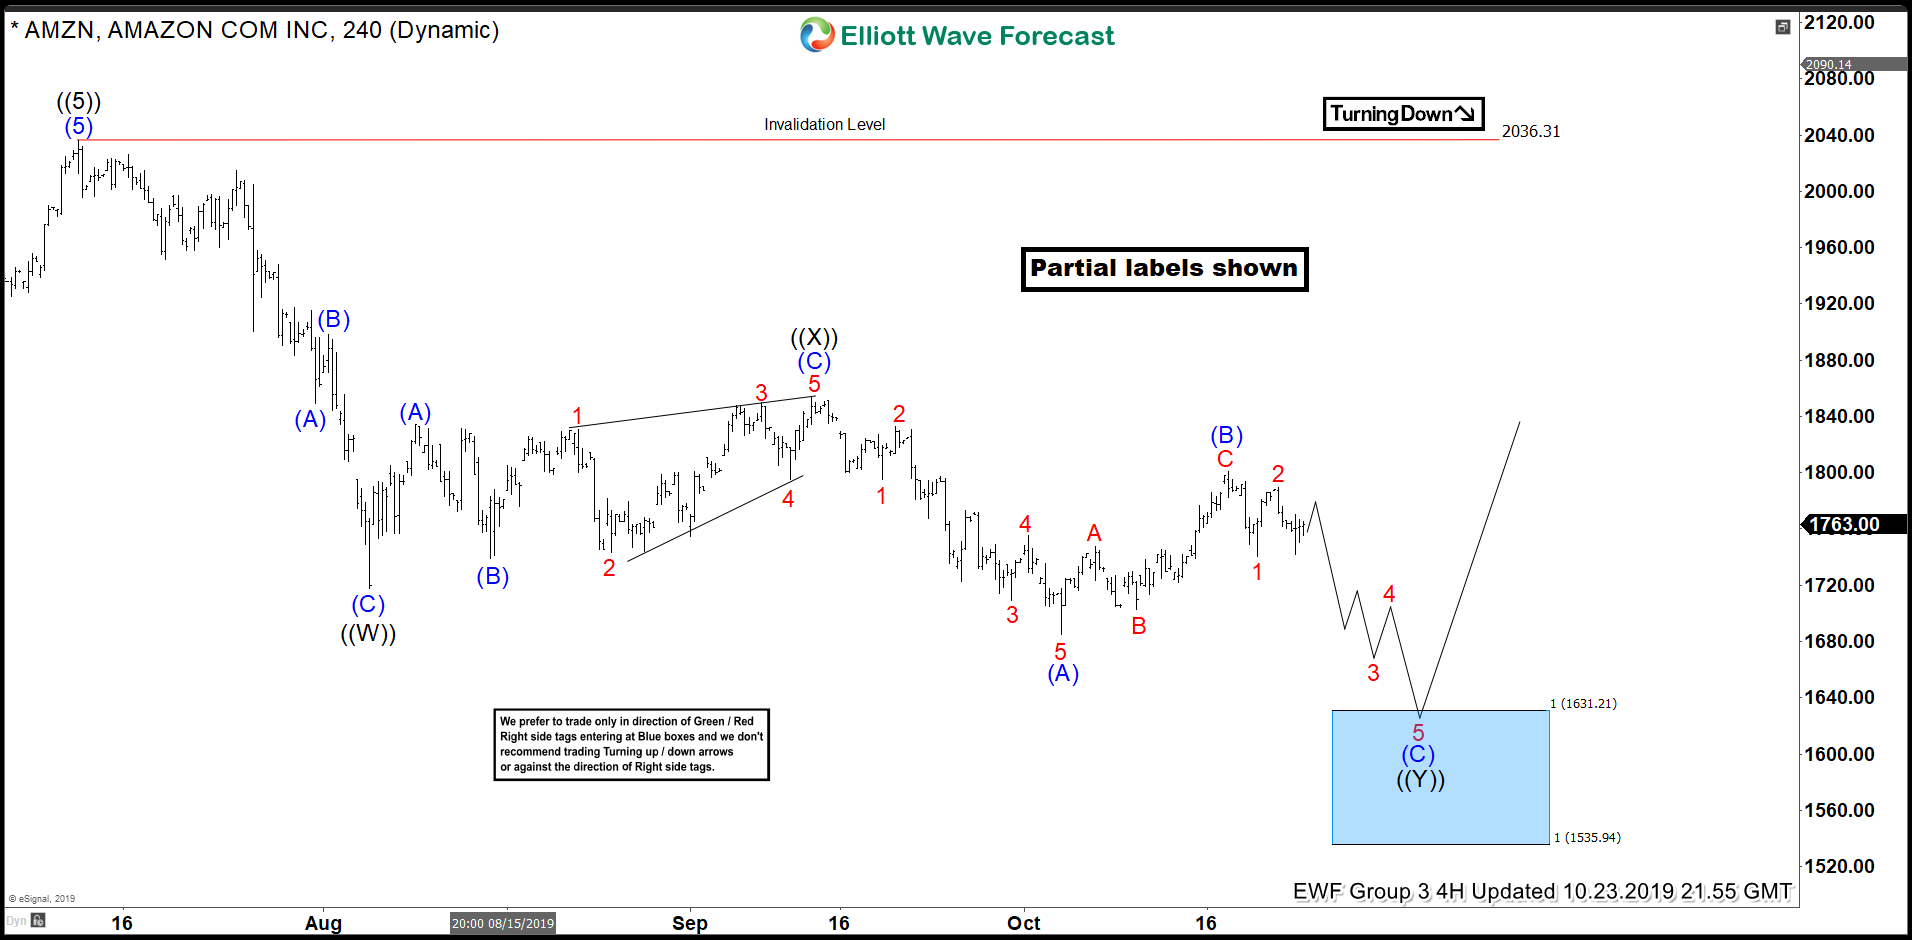
AMZN Buying The Elliott Wave Dips At Blue Box Area
Read MoreIn this technical blog, we are going to take a look at the past performance of 4 hour Elliott Wave charts of AMZN, which we presented to members. But, firstly we need to understand the market nature that it always fights between the two sides i.e Buying and Selling. We at elliottwave-forecast.com understand the Market Nature and always recommend trading the […]
-
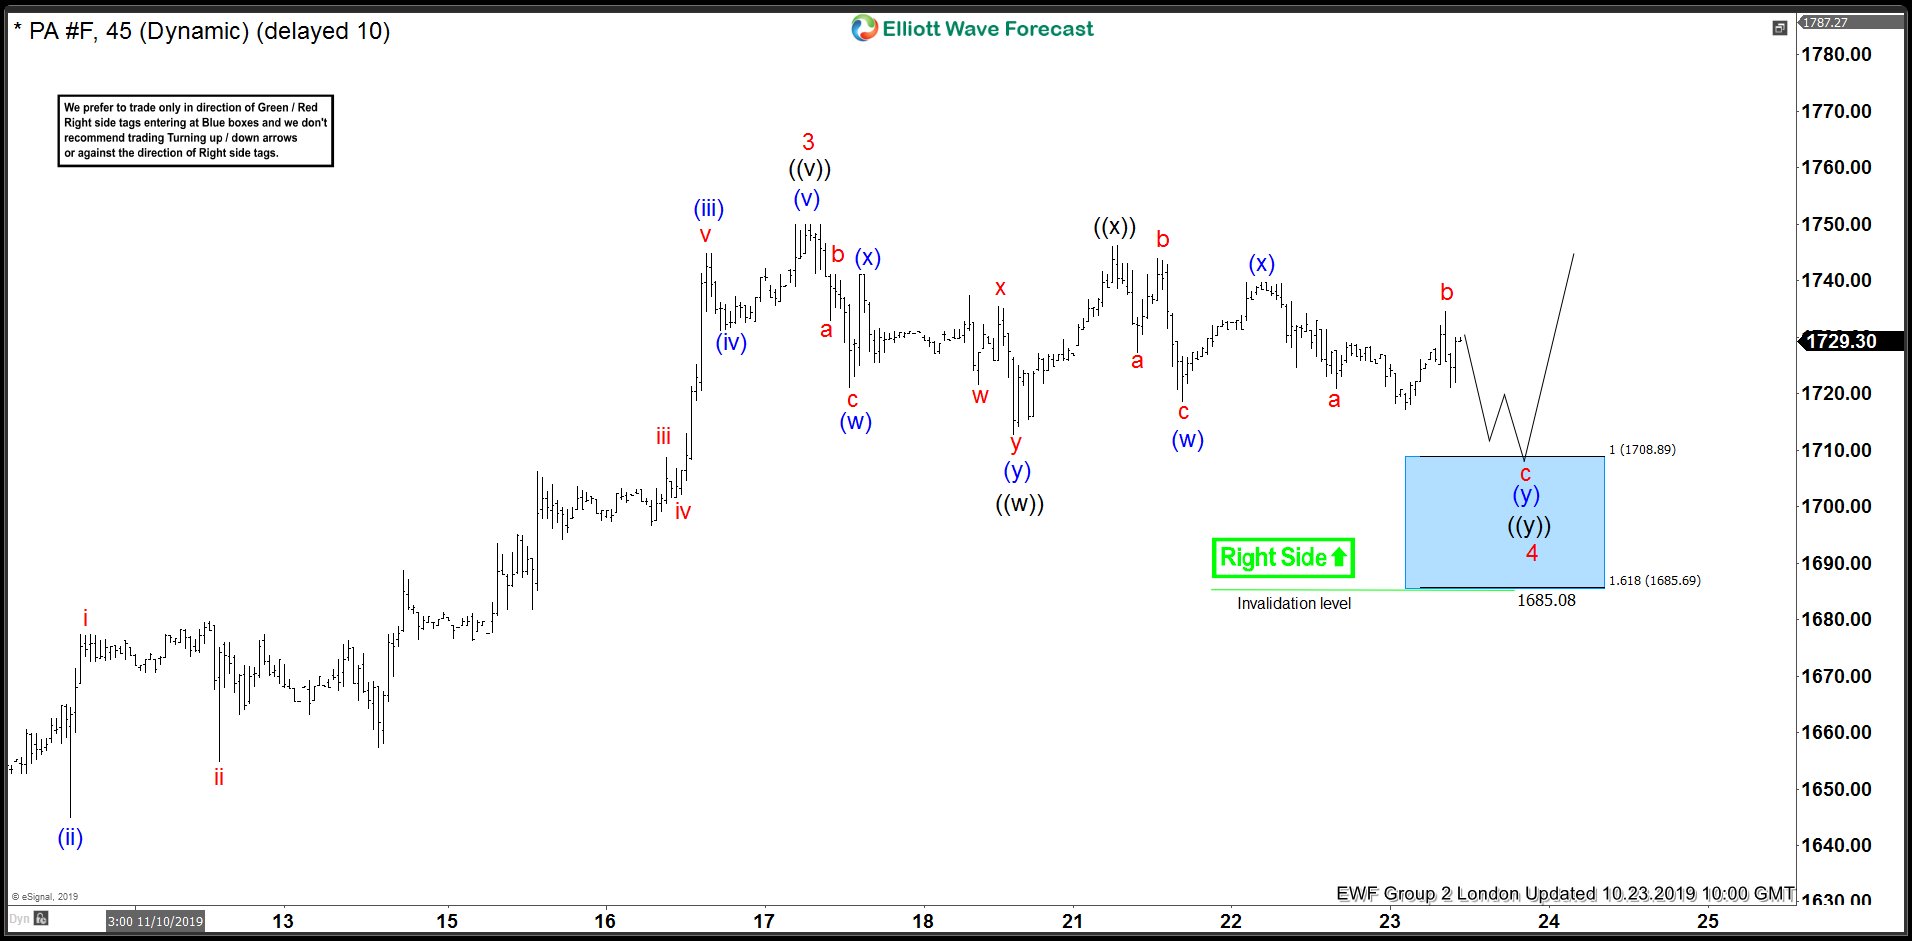
Palladium Elliott Wave View: Buying Short-Term Pullbacks
Read MoreIn this blog, we take a look at the 1 hour Elliott Wave charts performance of Palladium, which our members took advantage at the blue box extreme areas.
-
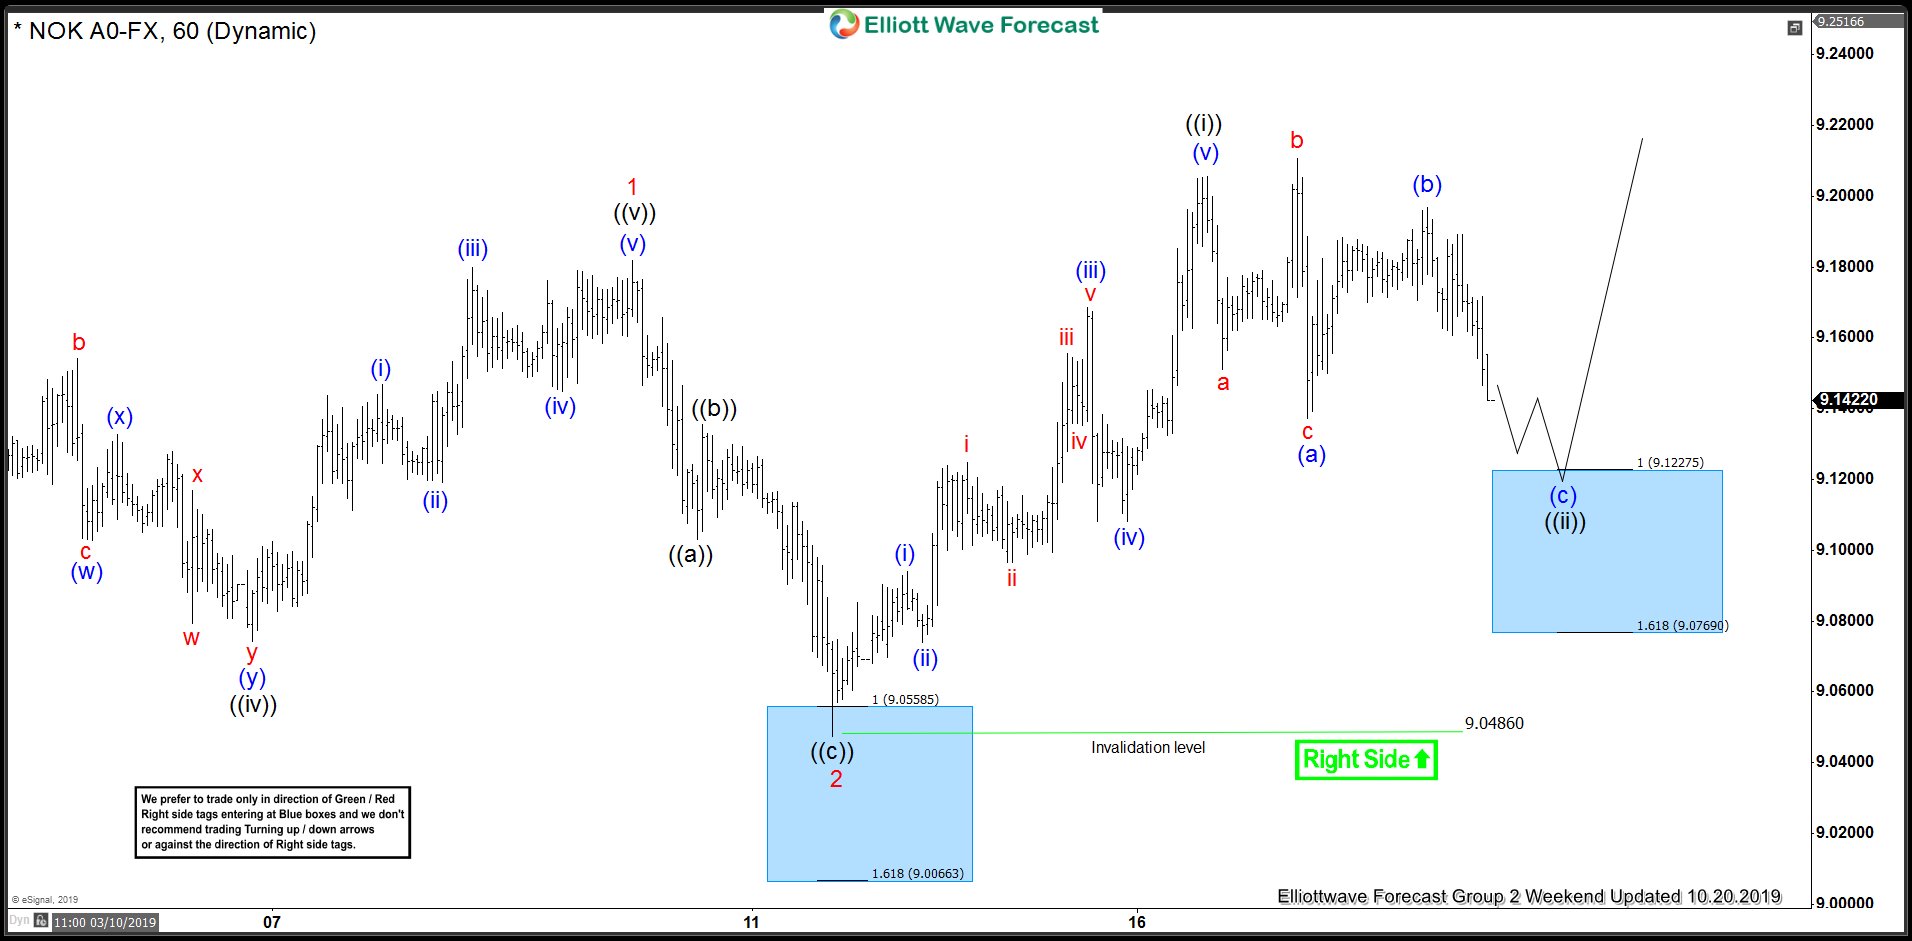
USDNOK Elliott Wave View: Buying The Short-Term Pullback
Read MoreIn this blog, we take a look at the 1 hour Elliott Wave charts performance of USDNOK, which our members took advantage at the blue box extreme areas.
-
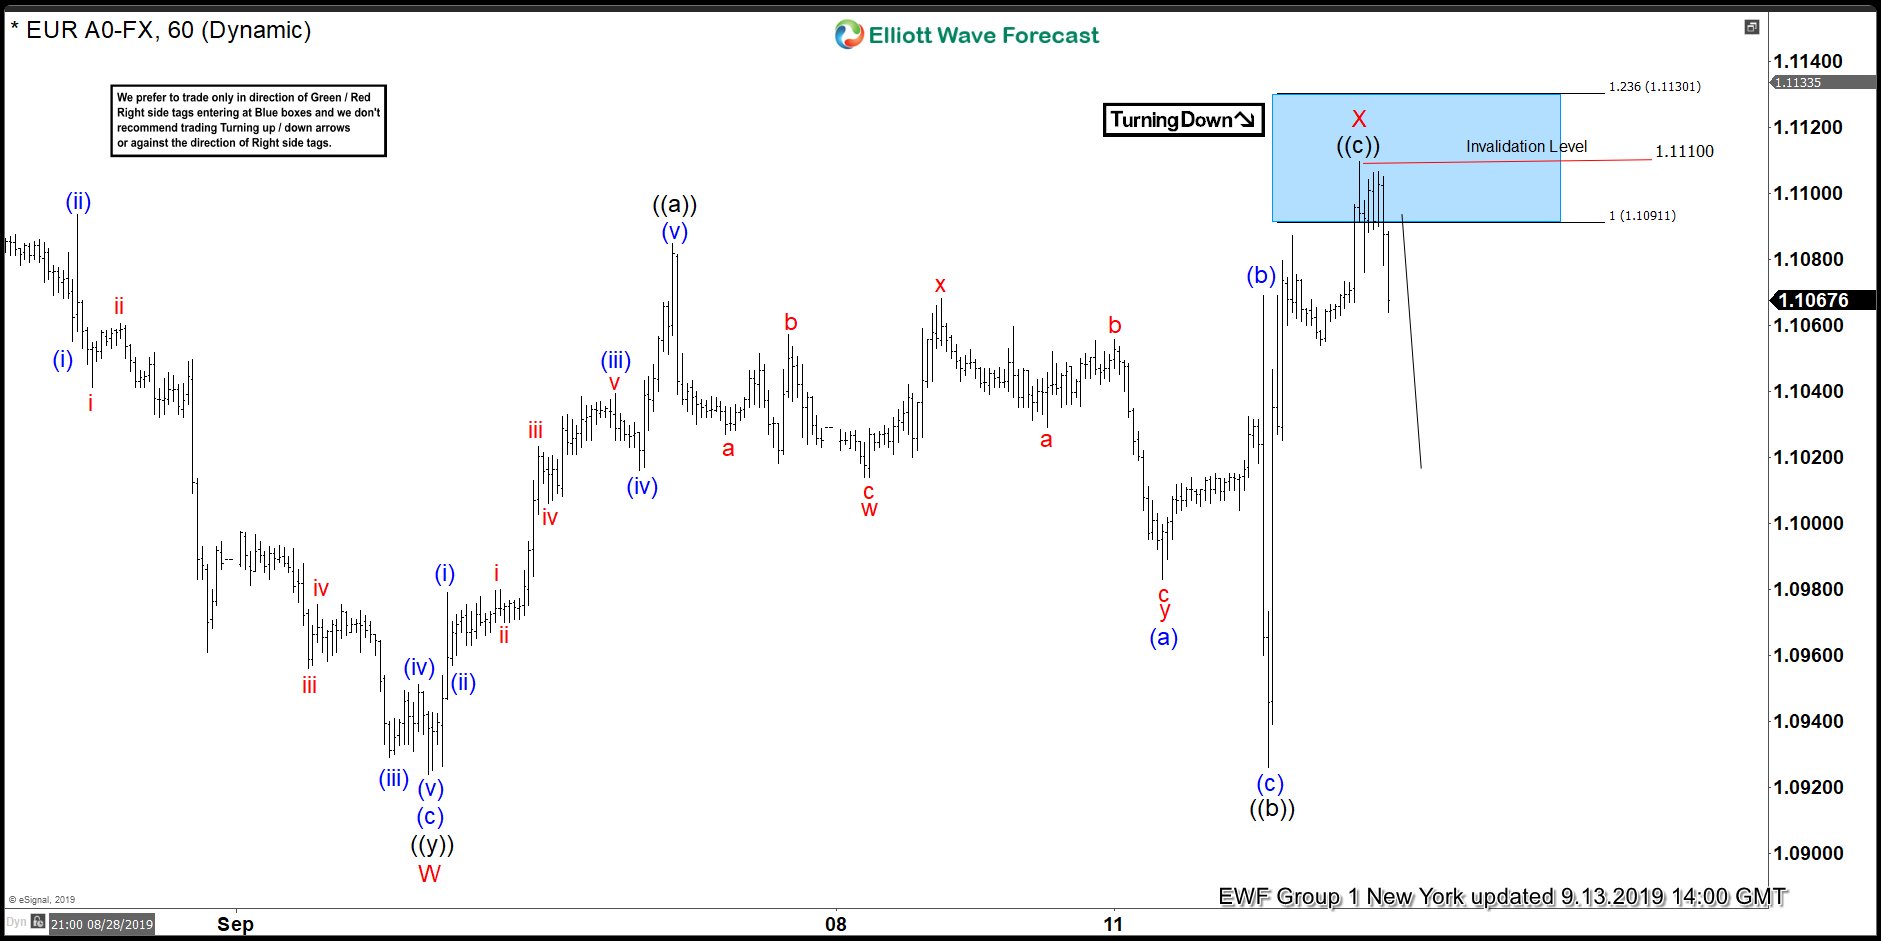
EURUSD Selling The Elliott Wave Bounce At Blue Box Area
Read MoreIn this blog, we take a look at the 1 hour Elliott Wave charts performance of EURUSD, which our members took advantage at the blue box extreme areas.
-
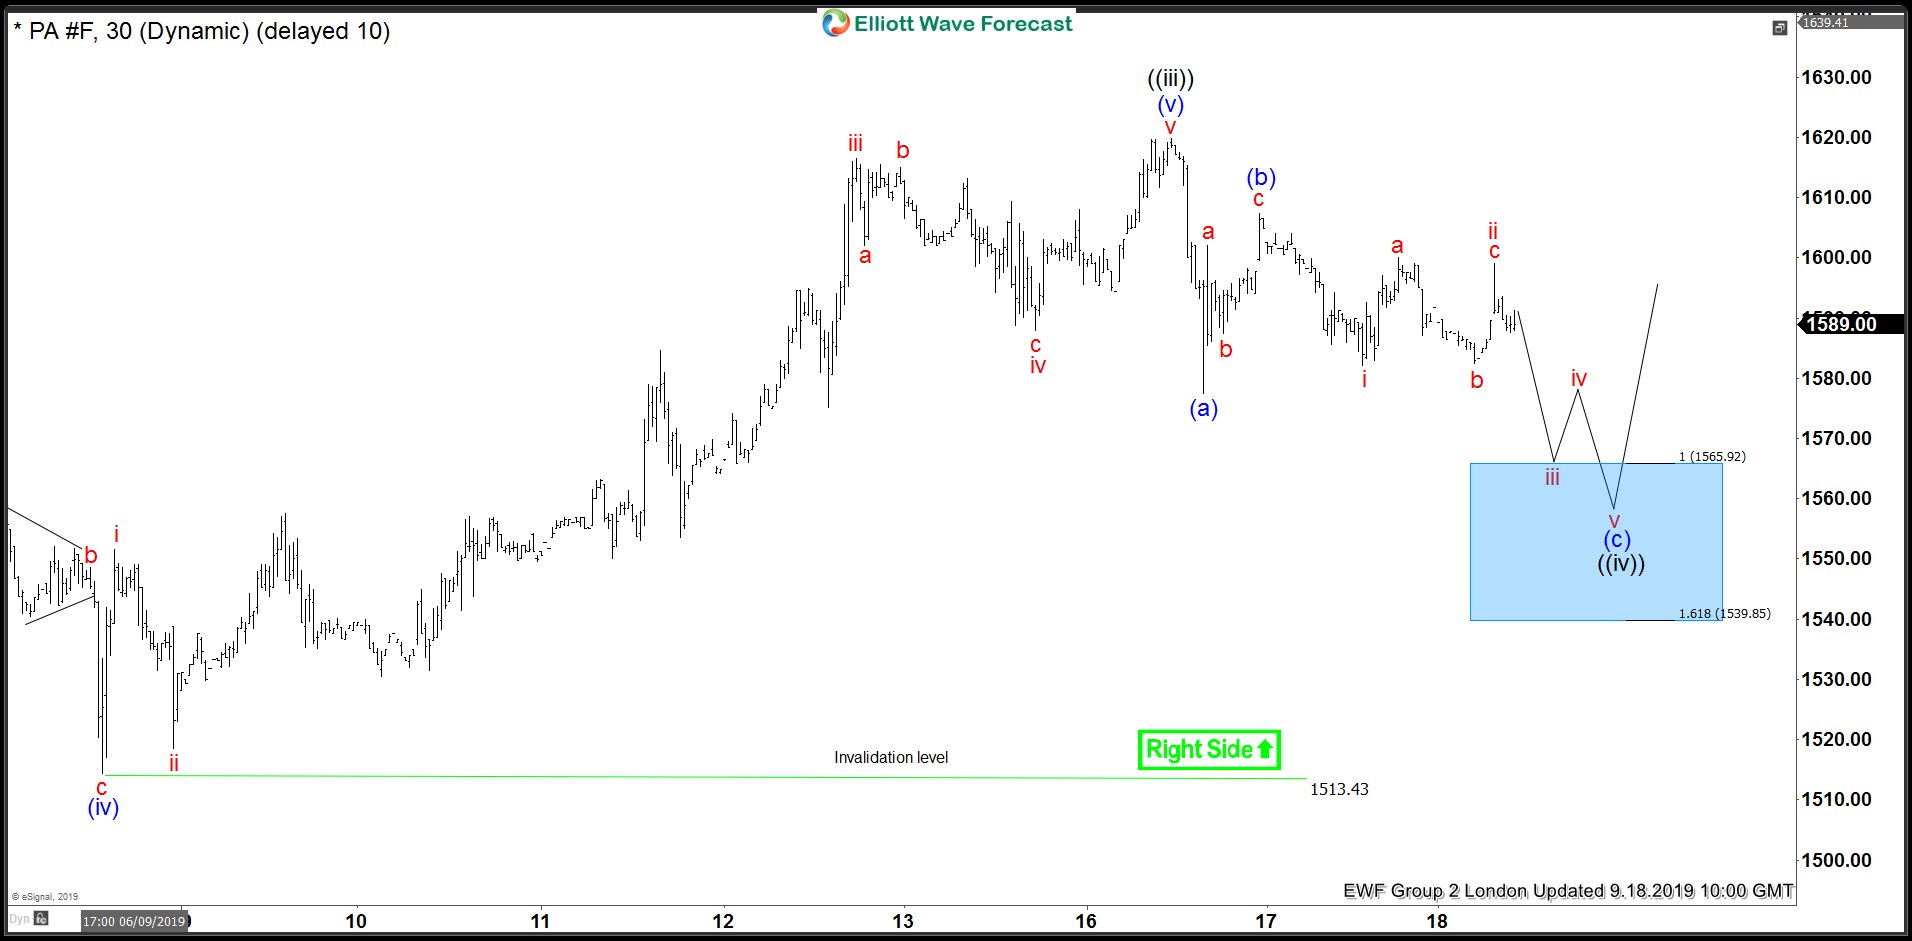
Palladium Bouncing From Elliott Wave Blue Box Area
Read MoreIn this blog, we take a look at the 1 hour Elliott Wave charts performance of Palladium, which our members took advantage at the blue box extreme areas.