
-
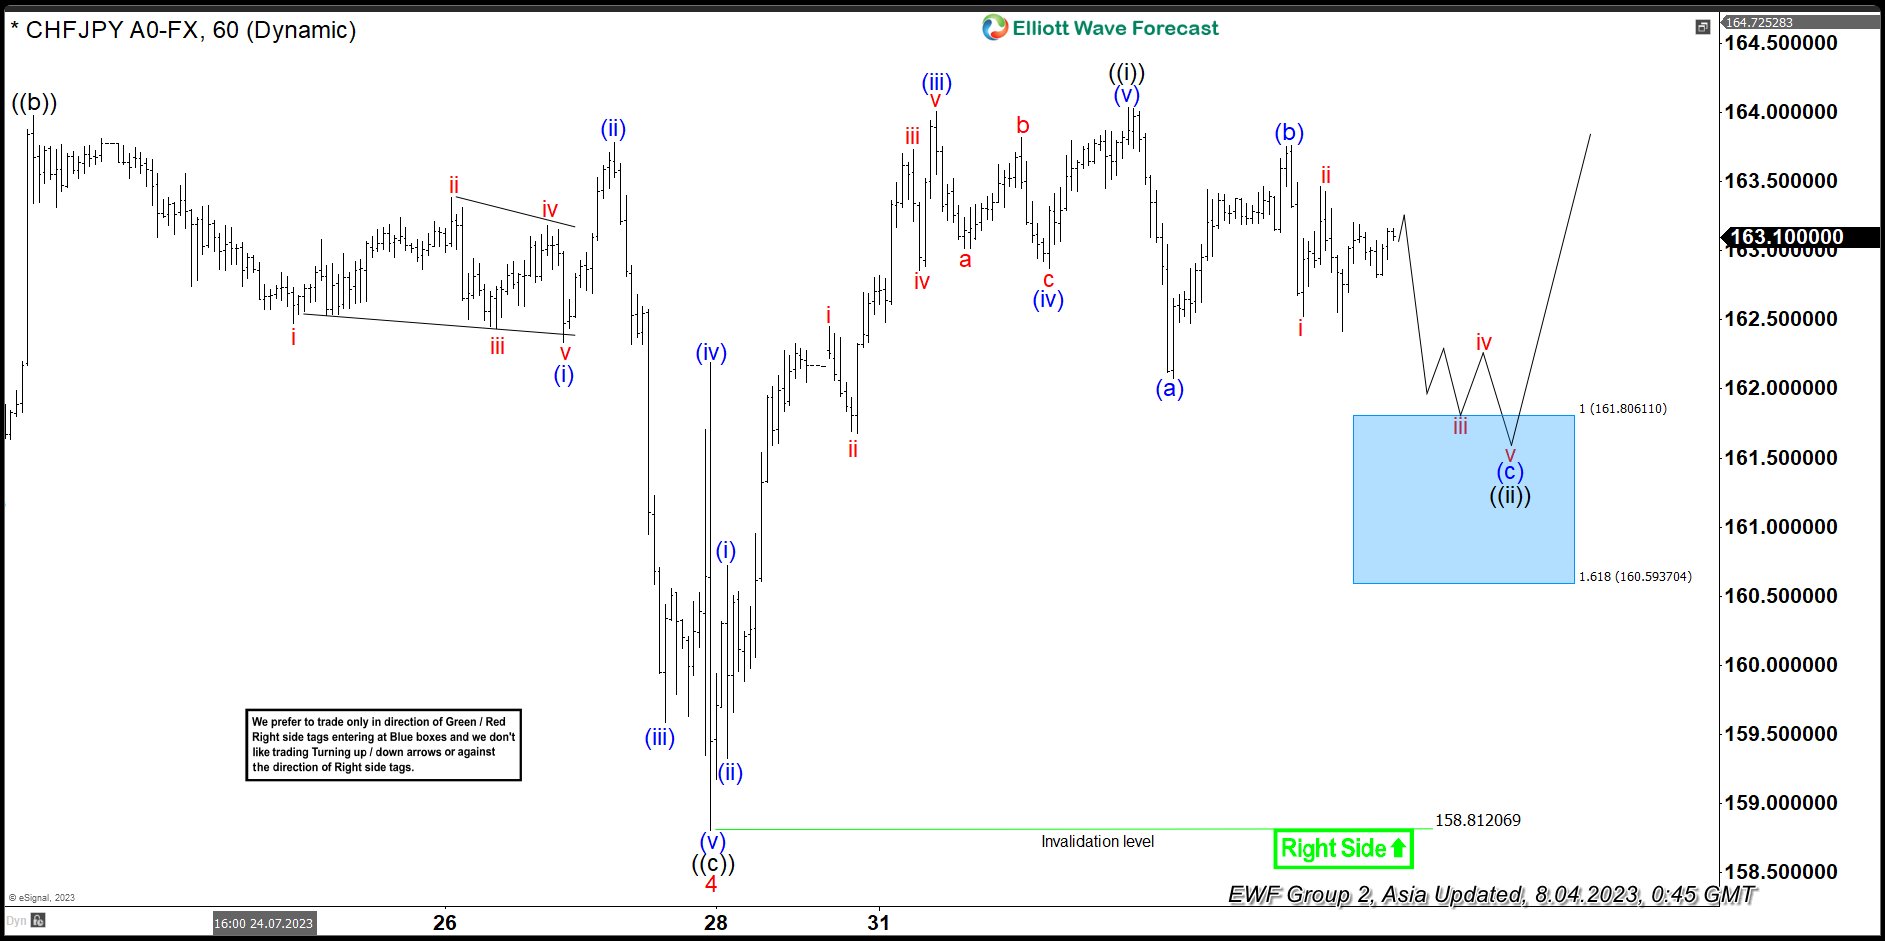
CHFJPY Pullbacks Are Expected To Remain Supported
Read MoreCHFJPY short term pullback from the peak are expected to remain supported in 3, 7 or 11 swings. This article and video look at the Elliott Wave path.
-
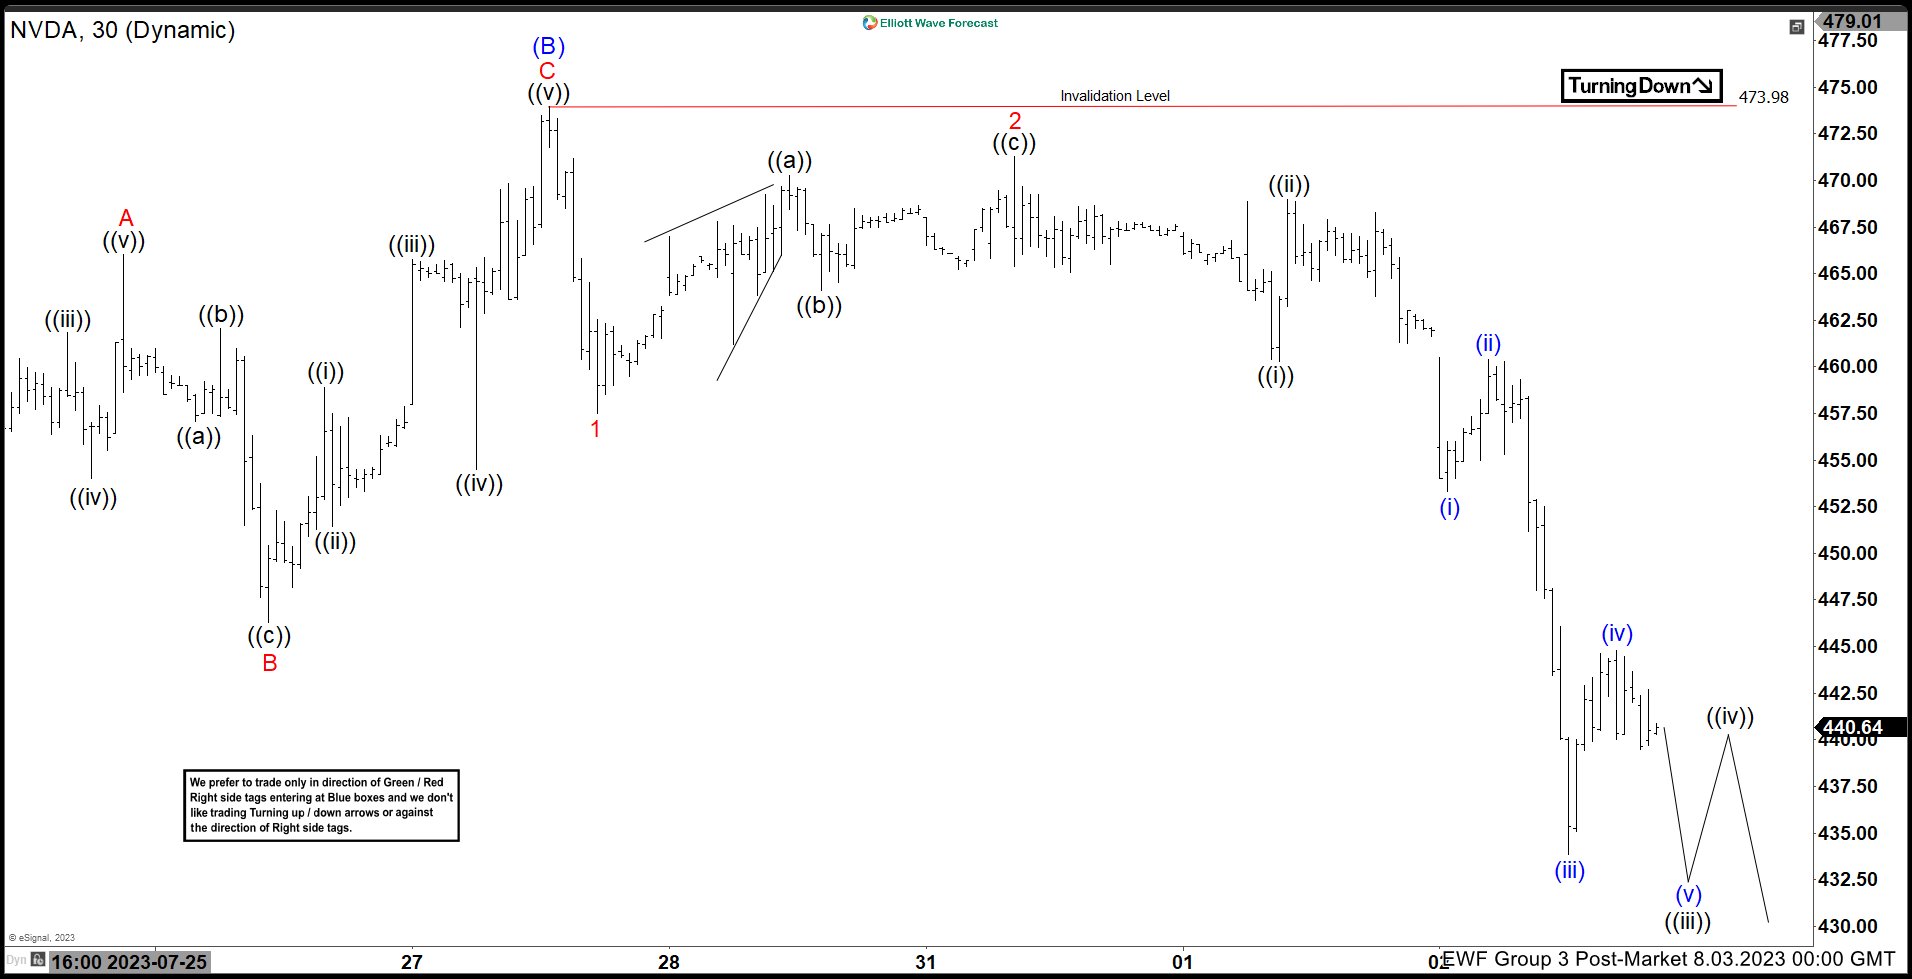
NVDA 3 Wave Pullback Soon Should Find Support
Read MoreNVDA short term pullback from the peak is expected to find support soon. This article and video look at the Elliott Wave path.
-
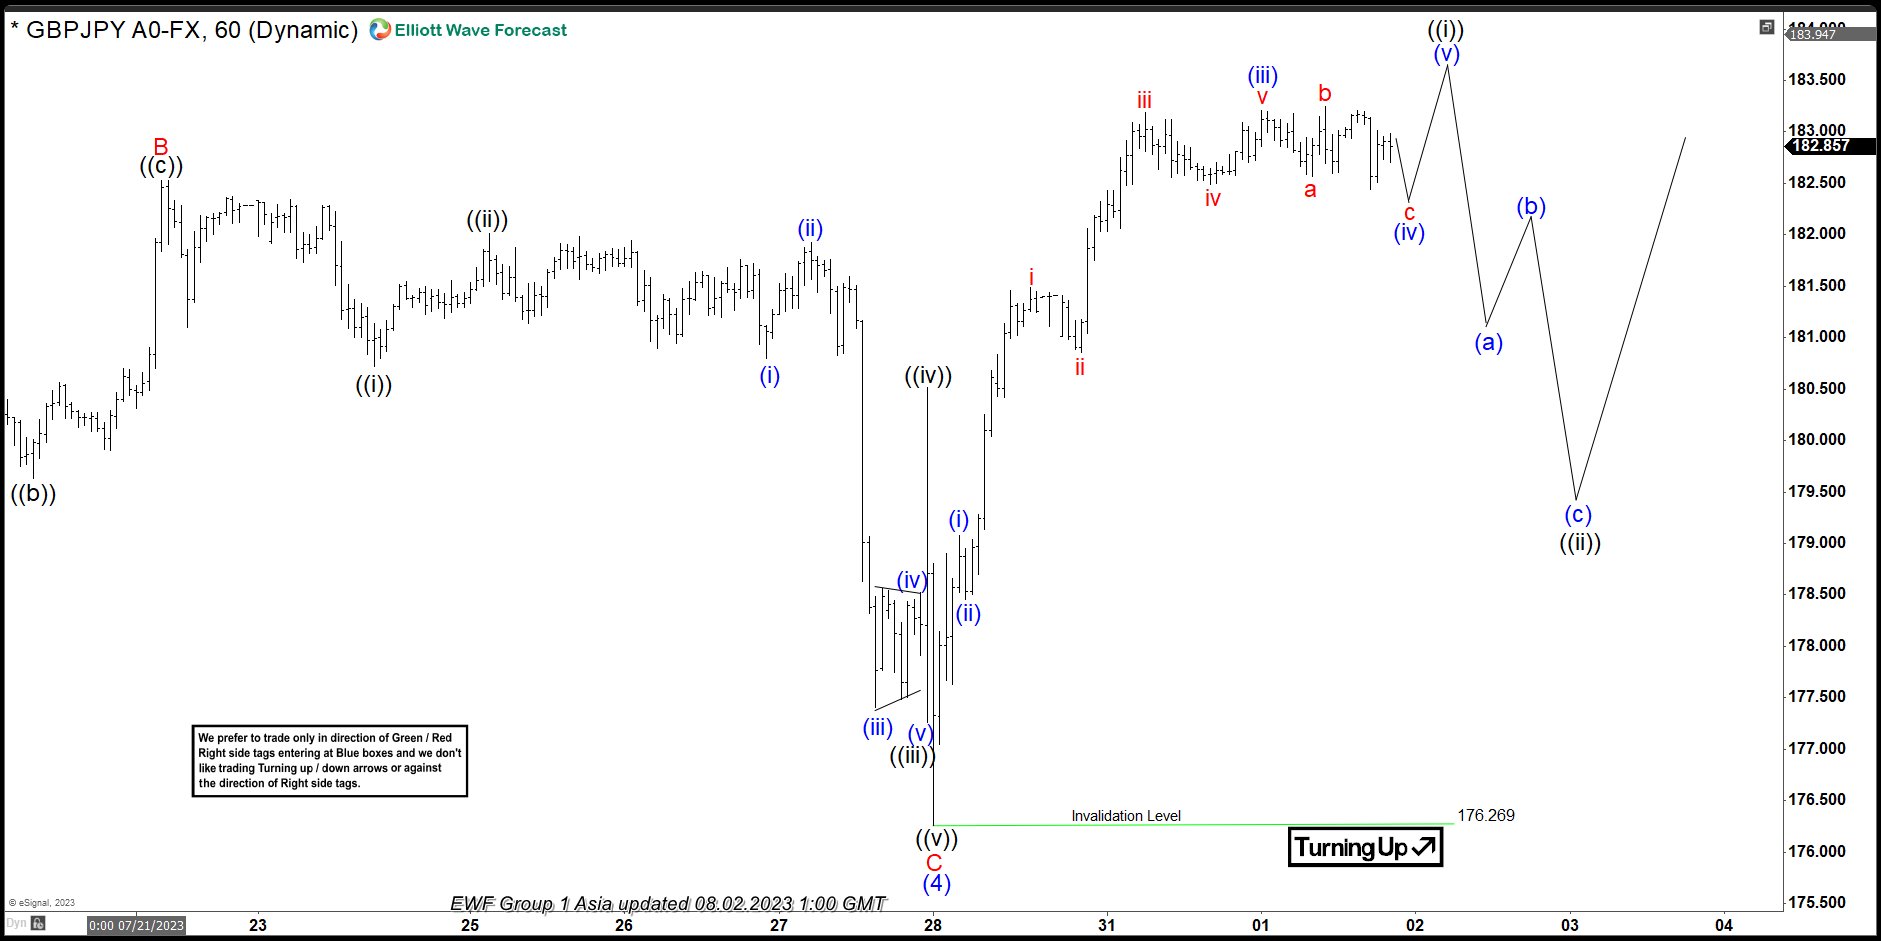
GBPJPY 3 Wave Pullback Coming After ending Impulse Rally
Read MoreGBPJPY the impulse rally from 7/28/2023 low is coming to an end & the pair is due a 3 wave pullback. This article and video look at the Elliott Wave path.
-
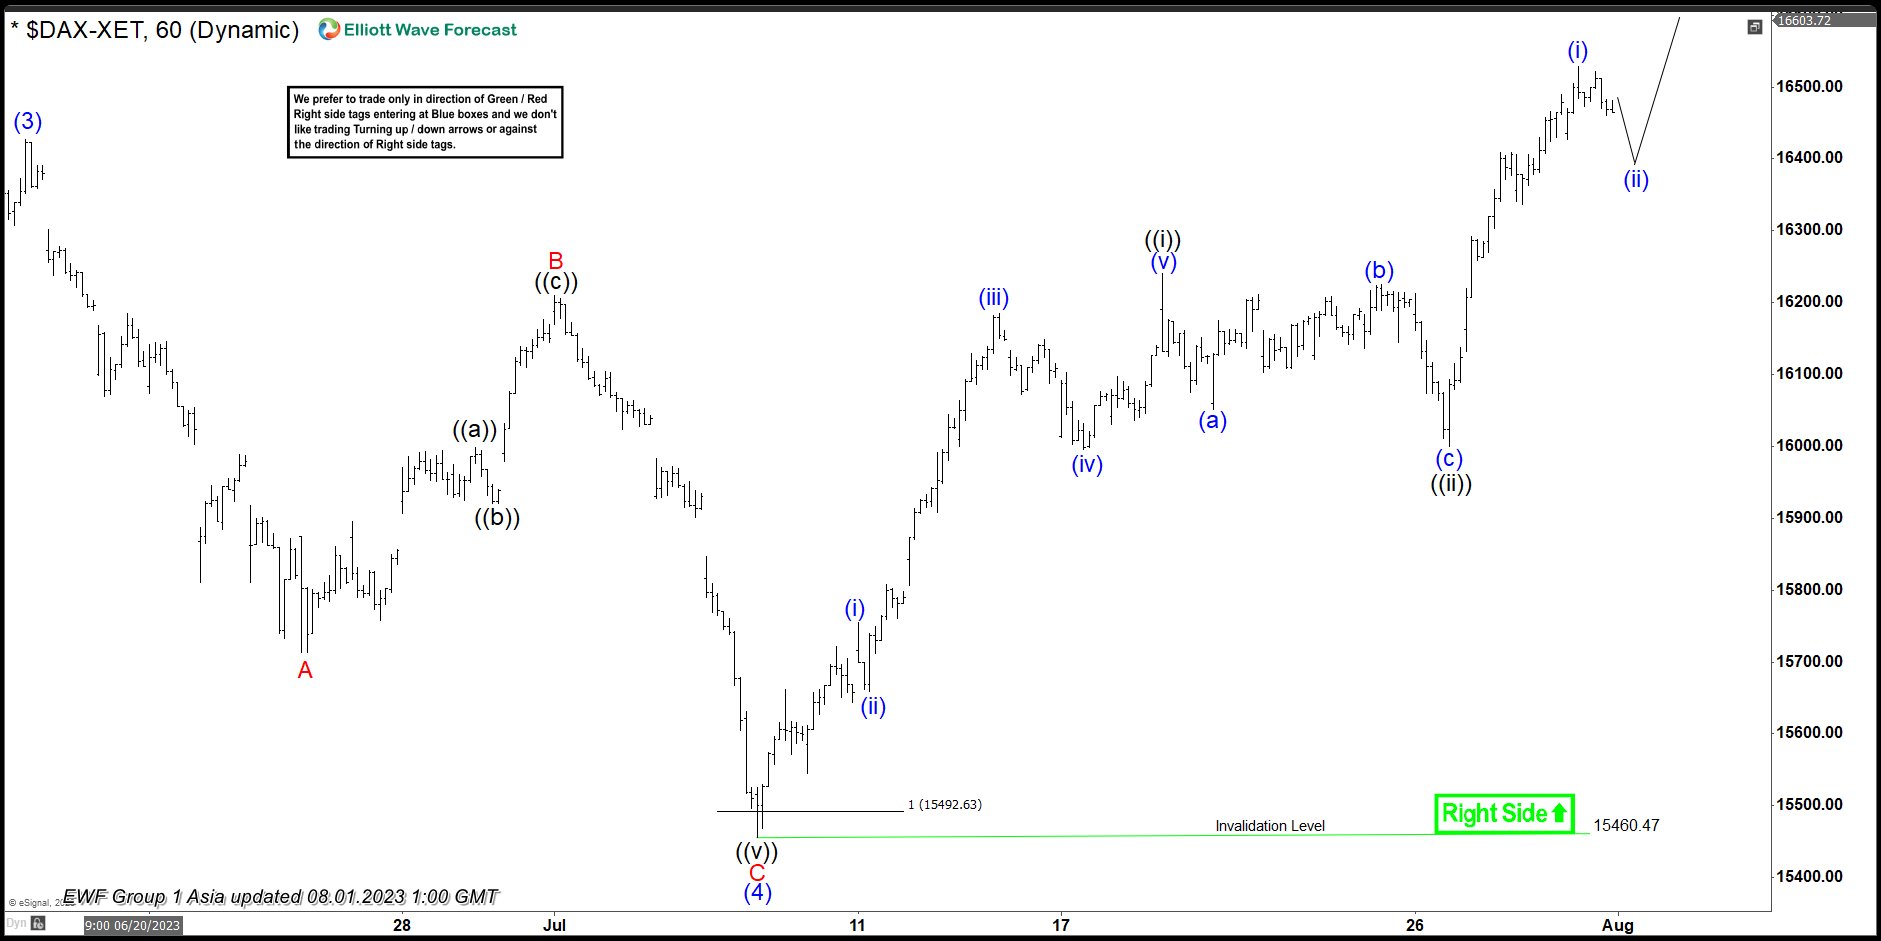
DAX Higher High Sequence Supports More Upside
Read MoreDAX short term cycle from 7.7.2023 low is showing a higher high sequence supports more upside. This article and video look at the Elliott Wave path.
-
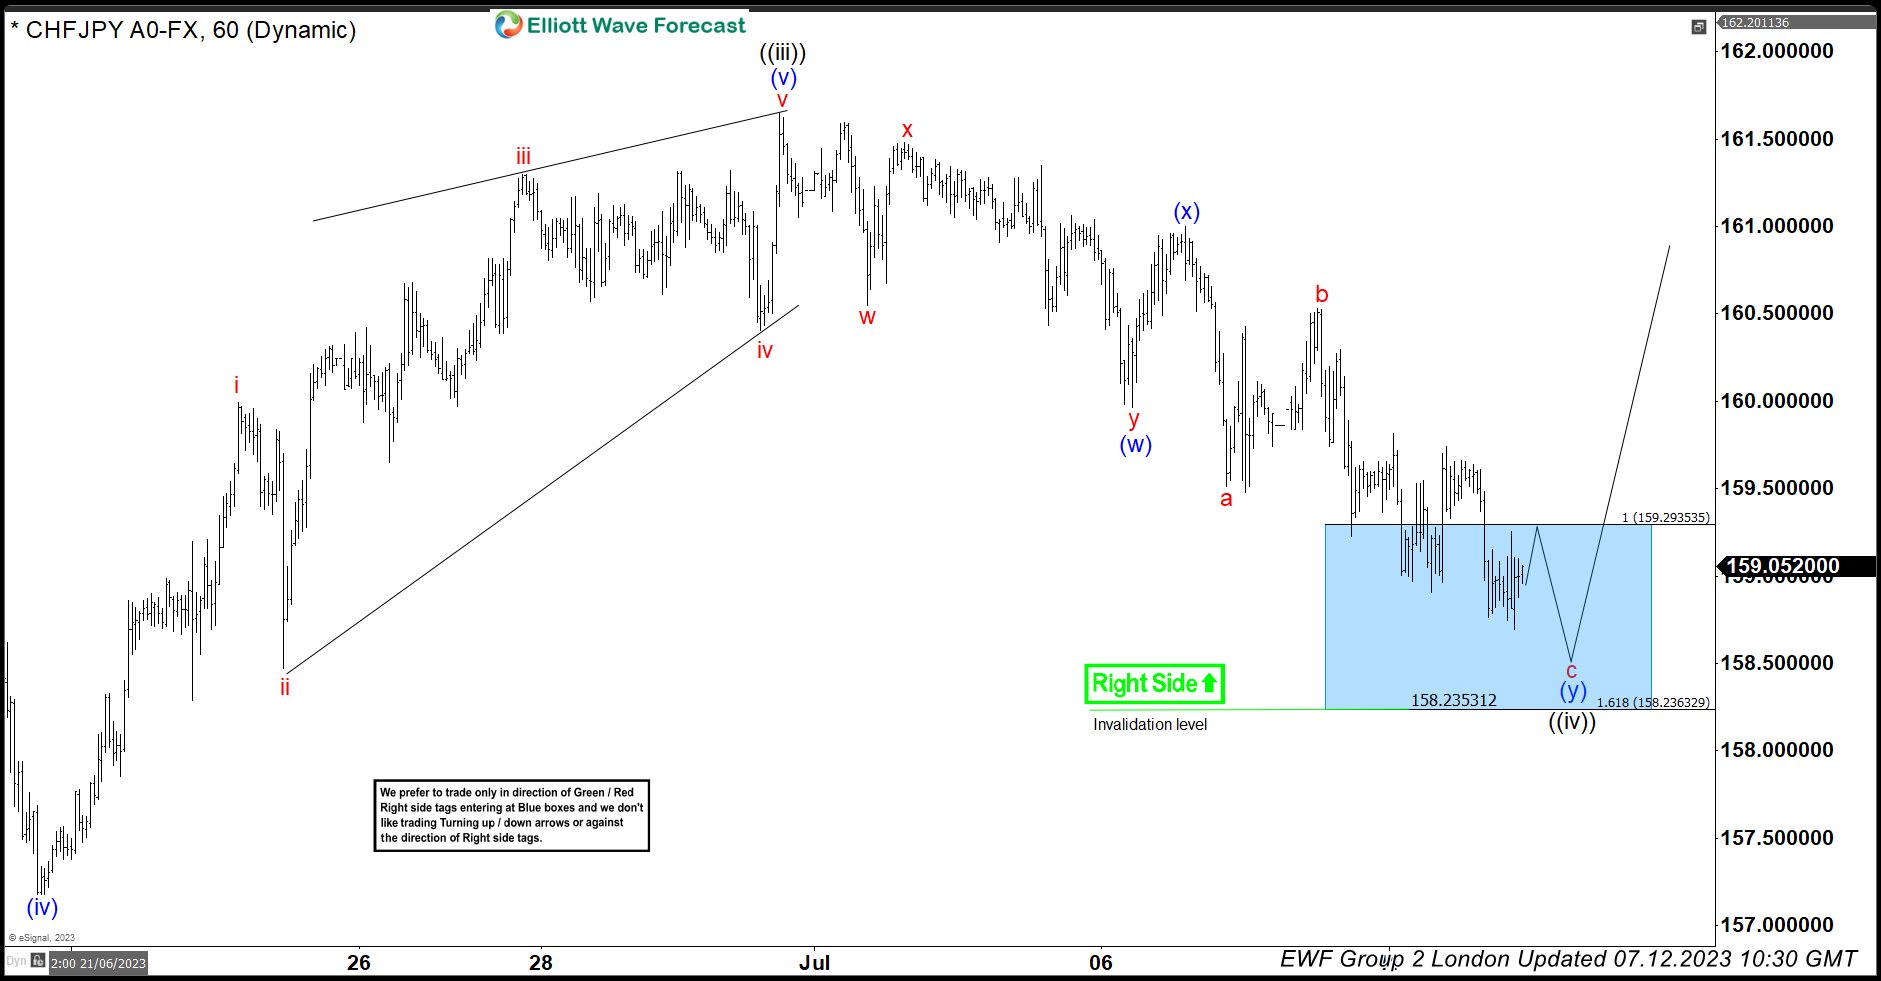
CHFJPY Strong Rally From The Elliott Wave Blue Box Area
Read MoreIn this blog, we take a look at the past performance of CHFJPY charts. The pair provided a buying opportunity in the blue box area.
-
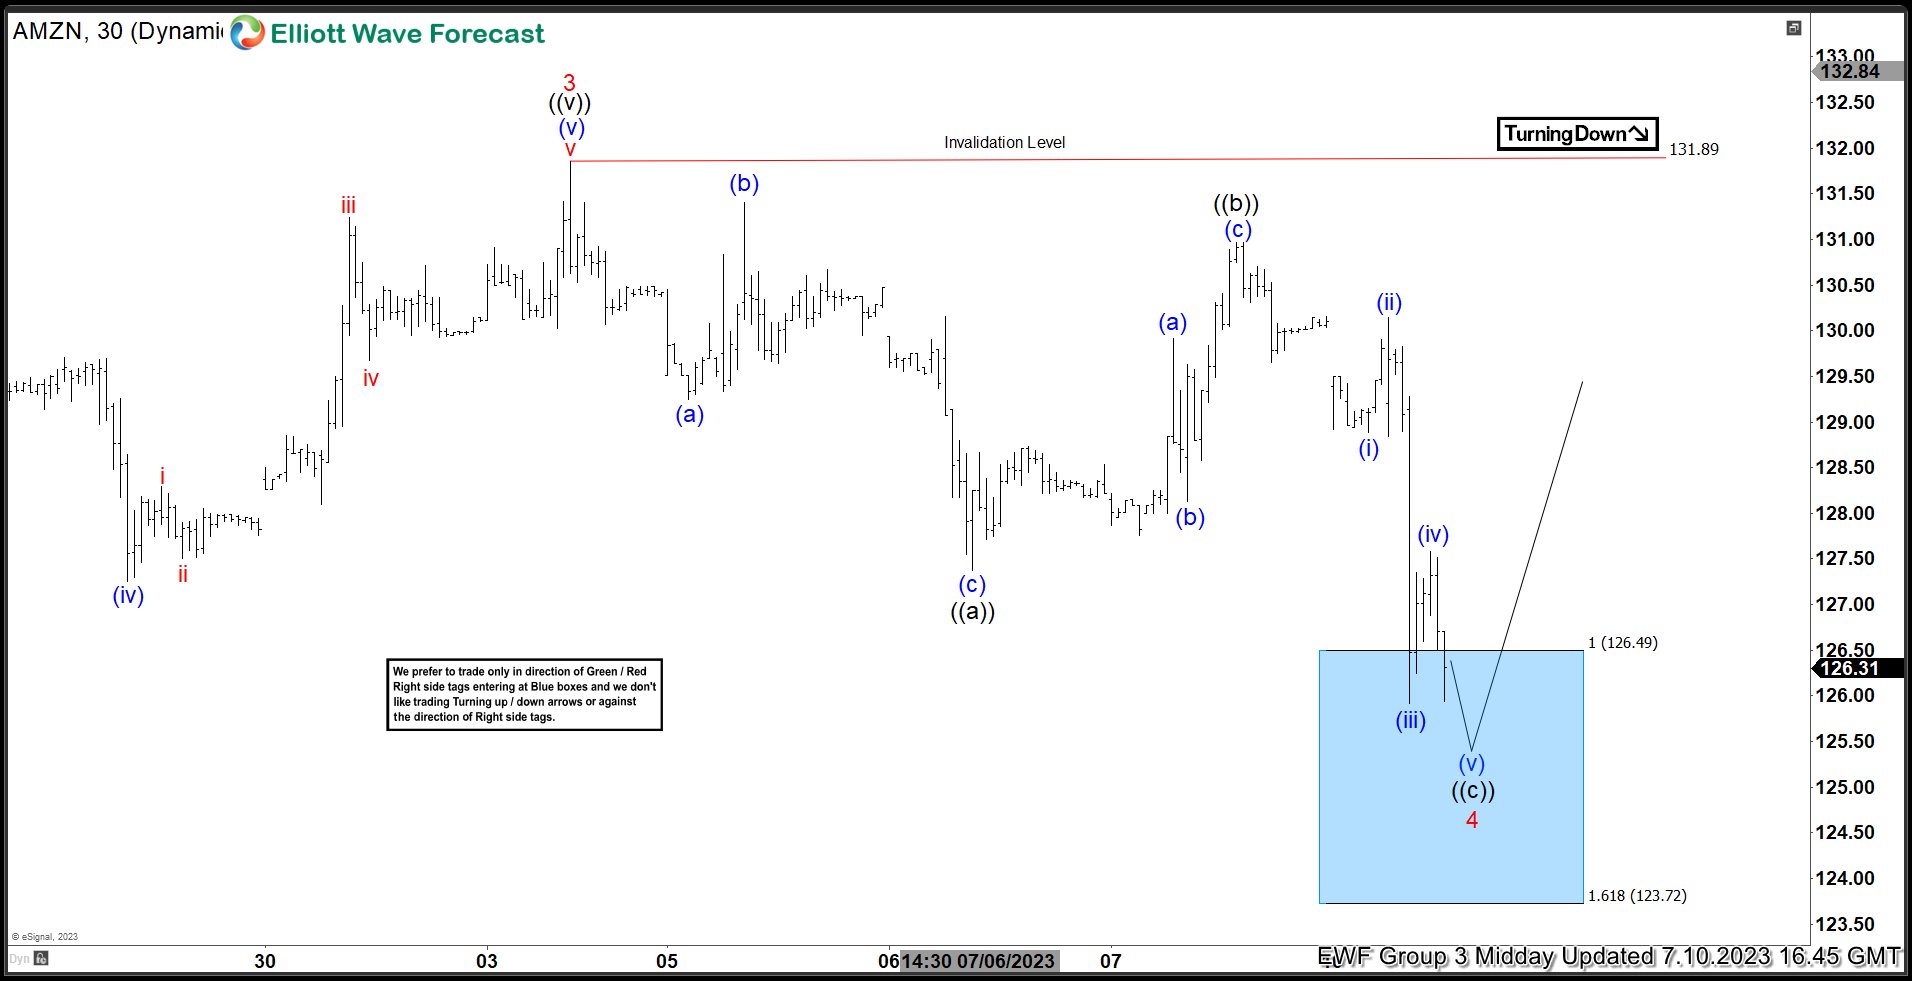
AMZN Keep Reacting Higher From The Blue Box Areas
Read MoreIn this blog, we take a look at the past performance of AMZN charts. The stock reacted higher from the blue box area where buyers were expected to appear.