
-
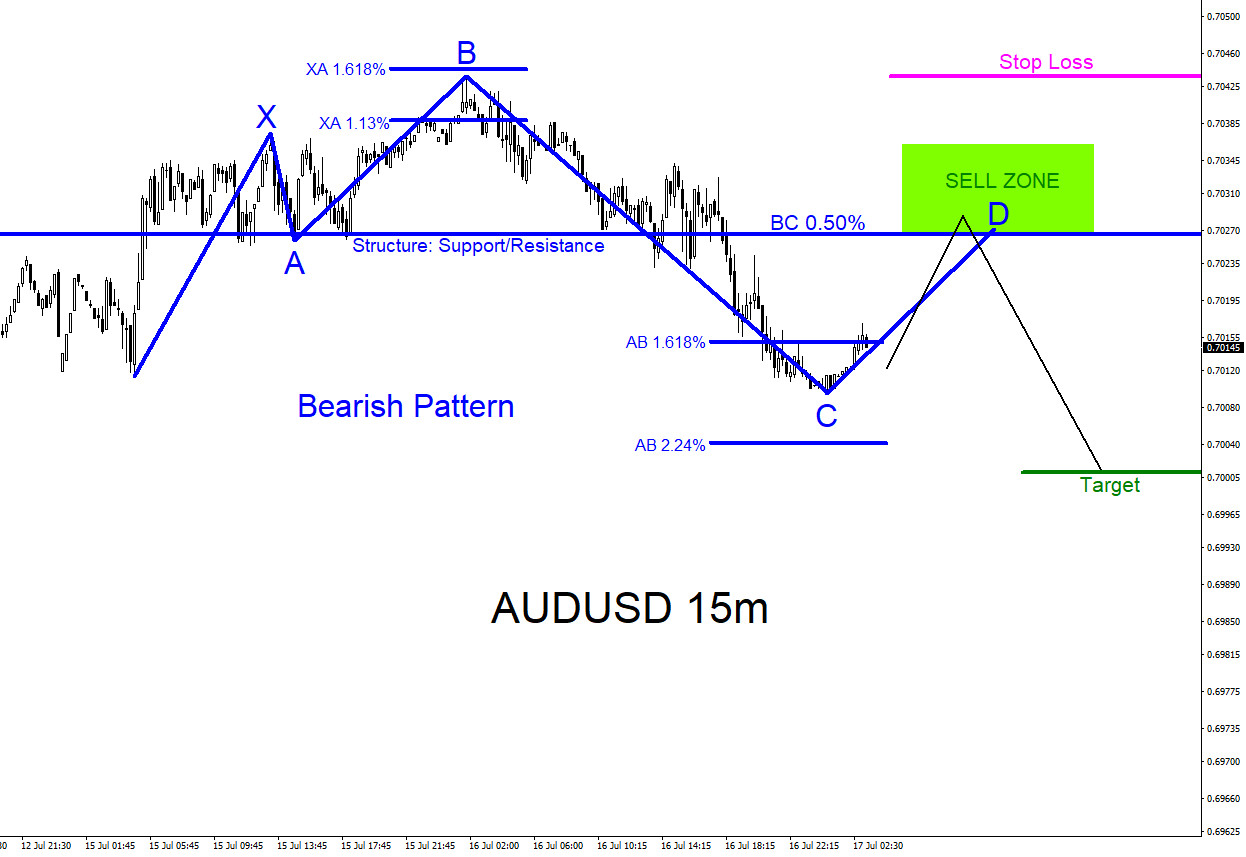
AUDUSD : Low Risk Trade Setup
Read MoreAUDUSD Technical Analysis July 17/2019 AUDUSD : A possible bearish pattern is clearly visible on the 15 minute chart. The blue bearish pattern still needs to make a small push higher to complete point D at the BC 0.50% Fib. retracement level where sellers will be possibly waiting to push the AUDUSD pair lower towards […]
-
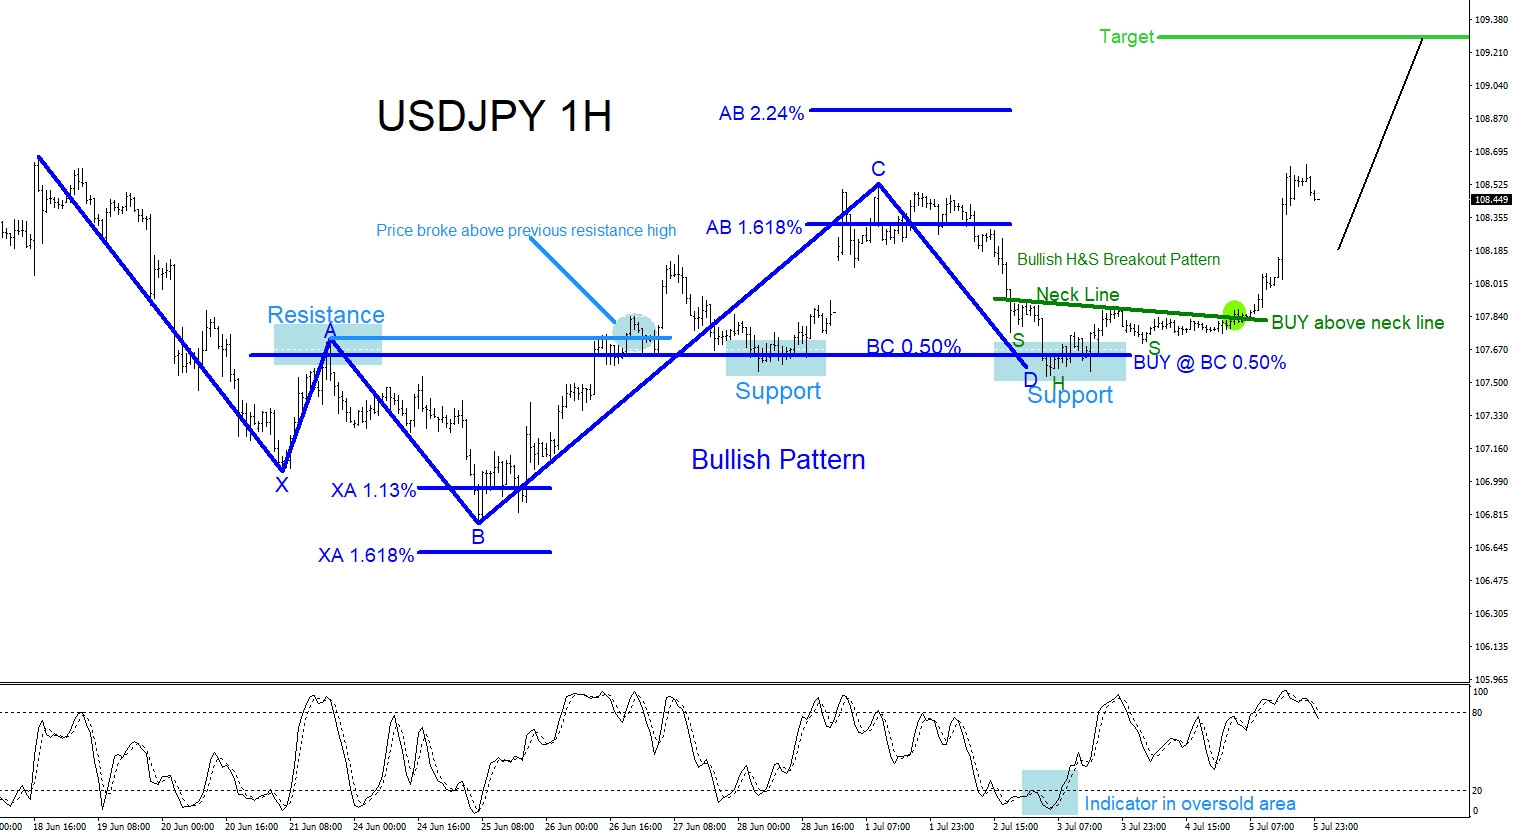
USDJPY : Trading Confluence Zones
Read MoreUSDJPY Technical Analysis USDJPY last week signalled bulls to enter the market. Why did traders decide to “BUY” the USDJPY pair towards the end of the week for a push higher? Some speculators will say because of fundamental analysis/news but technical traders will say because price hit a confluence zone. Trading confluence is when 2 […]
-
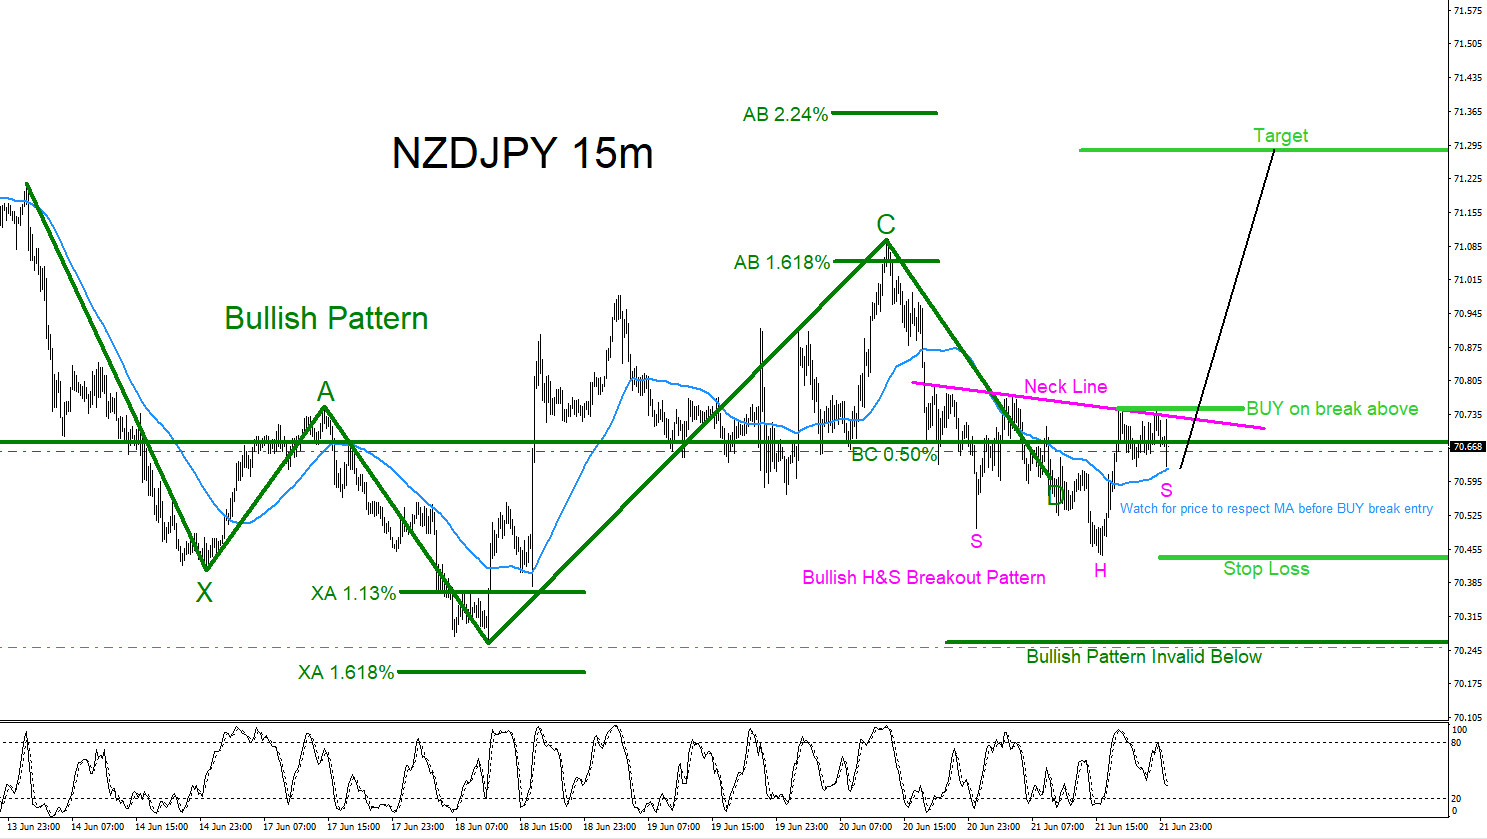
NZDJPY : Possible Scenario Higher?
Read MoreNZDJPY Technical Analysis June 23/2019 NZDJPY remains bullish as long as the June 18/2019 low remains untouched. On the 15 minute time frame there are clear visible bullish patterns that can be seen. In the chart below, market patterns are used to determine where price can possibly pause and reverse higher. The green bullish pattern […]
-
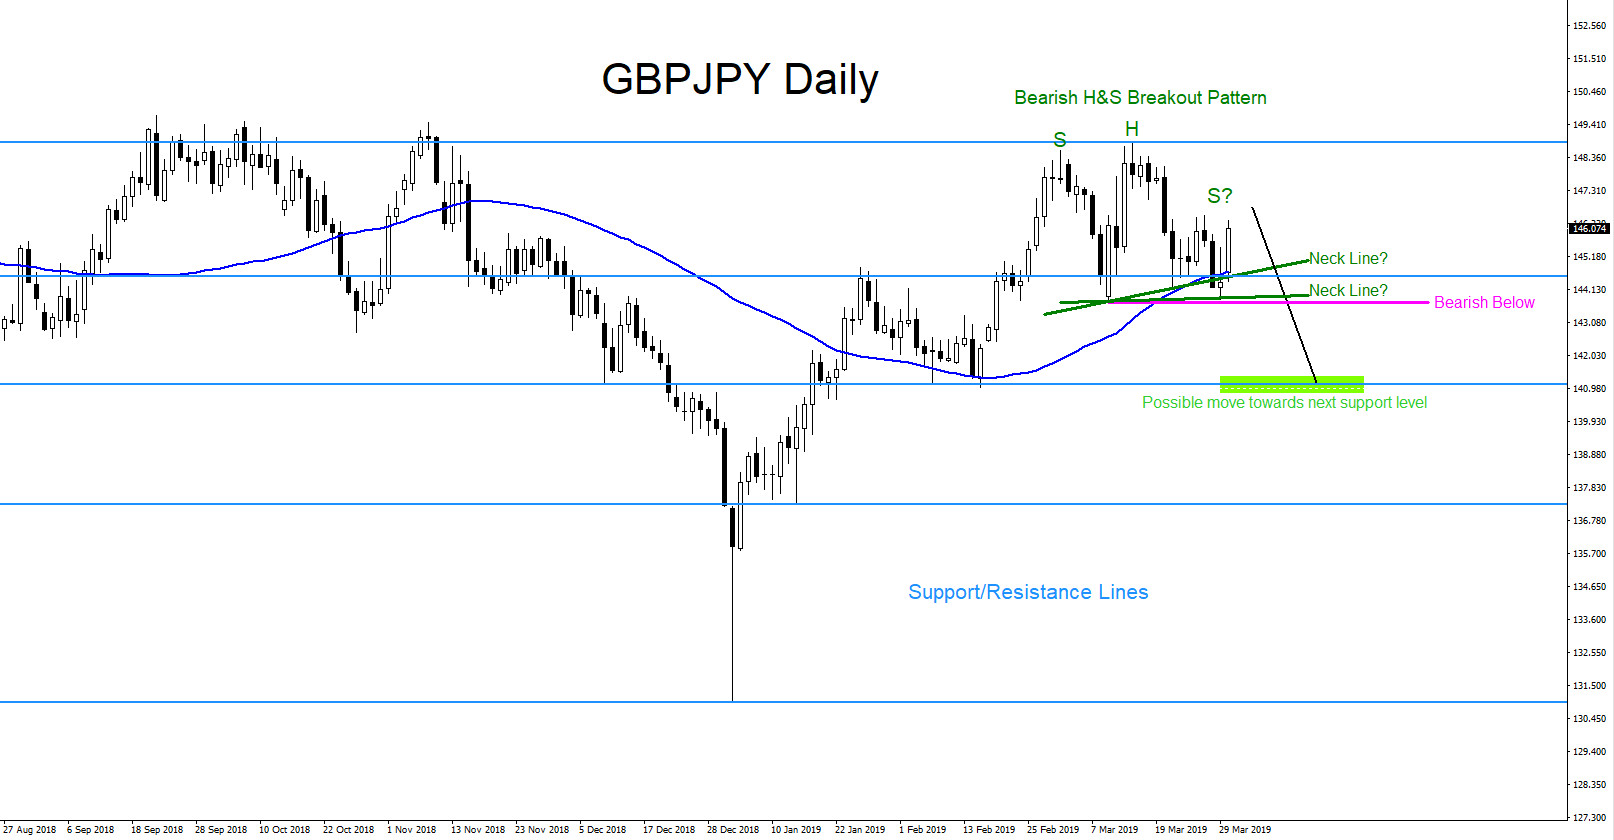
GBPJPY : Market Patterns Calling Move Lower
Read MoreGBPJPY Technical Analysis GBPJPY Daily Chart April 1/2019 : On April 1/2019 I posted chart on Twitter of the possibility that the pair could be forming a Bearish Head & Shoulders Breakout Pattern. Traders needed to be patient and wait for the right shoulder to terminate then followed by a break lower below the neck line […]
-
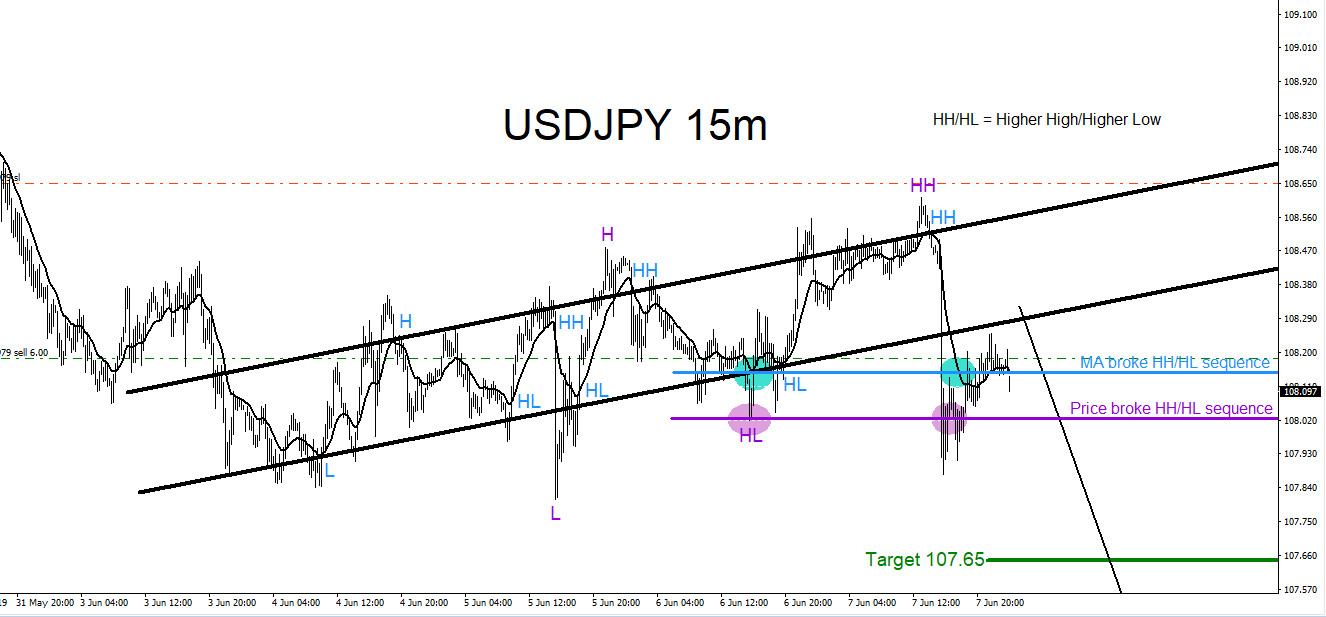
USDJPY : Will Pair Continue Lower?
Read MoreUSDJPY Technical Analysis June 9/2019 USDJPY 15 Minute Chart June 8/2019: A bearish view can be seen on the 15 minute chart. In the chart below, price has broken below the previous higher low level (purple) which can be signalling that USDJPY may now shift and move lower to make newer lows. Breaking below the previous […]
-
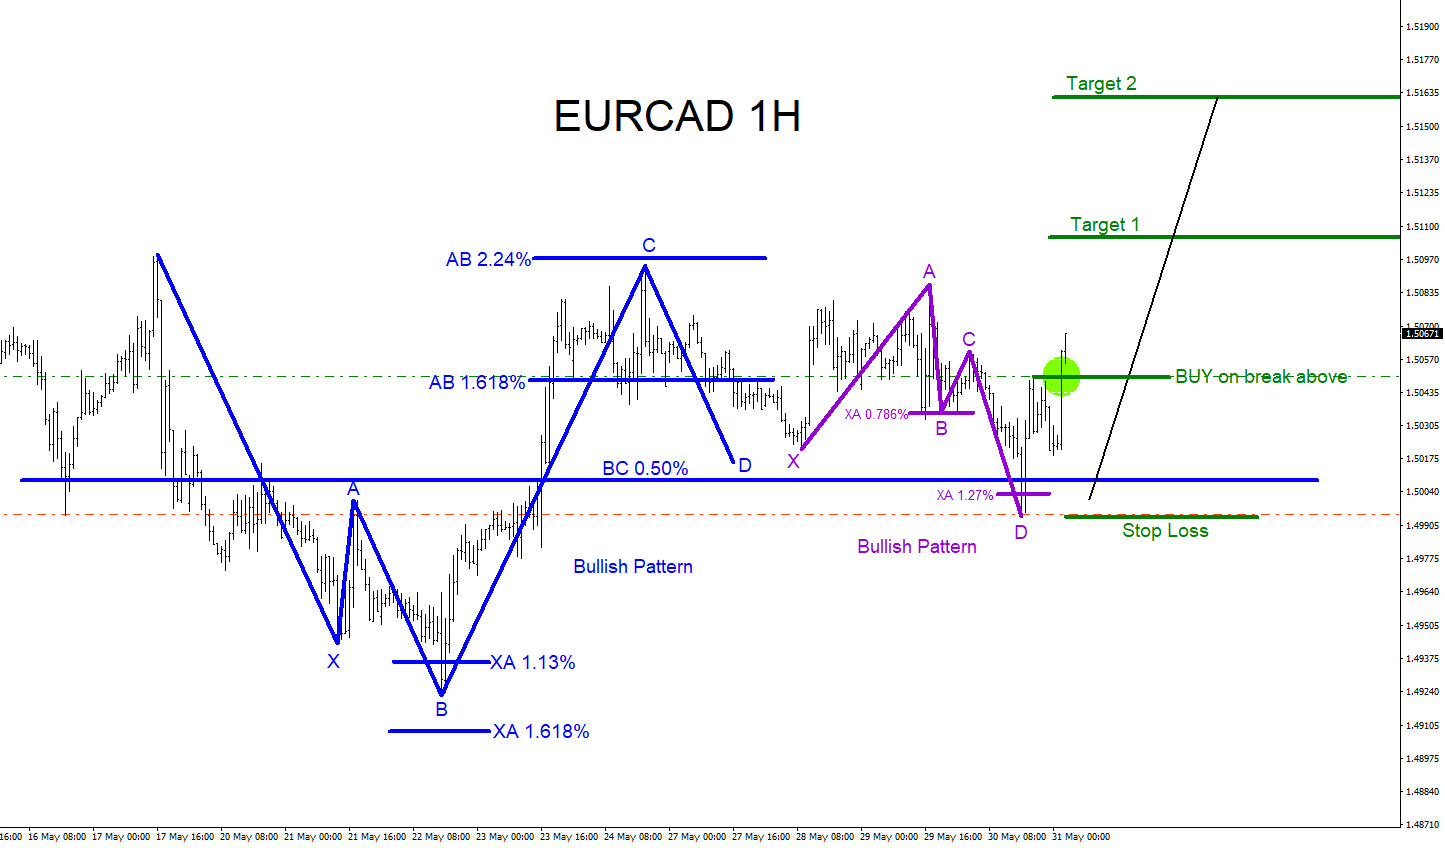
EURCAD : Elliott Wave + Bullish Patterns Calling Move Higher?
Read MoreEURCAD Technical Analysis May 30/2019 EURCAD : Bullish market patterns can be seen on the EURCAD 1 hour chart. In the chart below, both the blue and purple bullish patterns have already triggered BUYS. Blue bullish pattern triggered BUYS at the BC 0.50% Fib. retracement level and the purple bullish pattern triggered BUYS at the […]