

On April 18 2024 I posted on social media @AidanFX the EURJPY BUY setup chart. The pair was in an uptrend and price moved into the demand/buy zone (Blue) where the buy entry was triggered. EURJPY 4 Hour Chart April 18 2024 EURJPY 4 Hour Chart April 23 2024 Entered the BUY trade at 163.06 […]
-
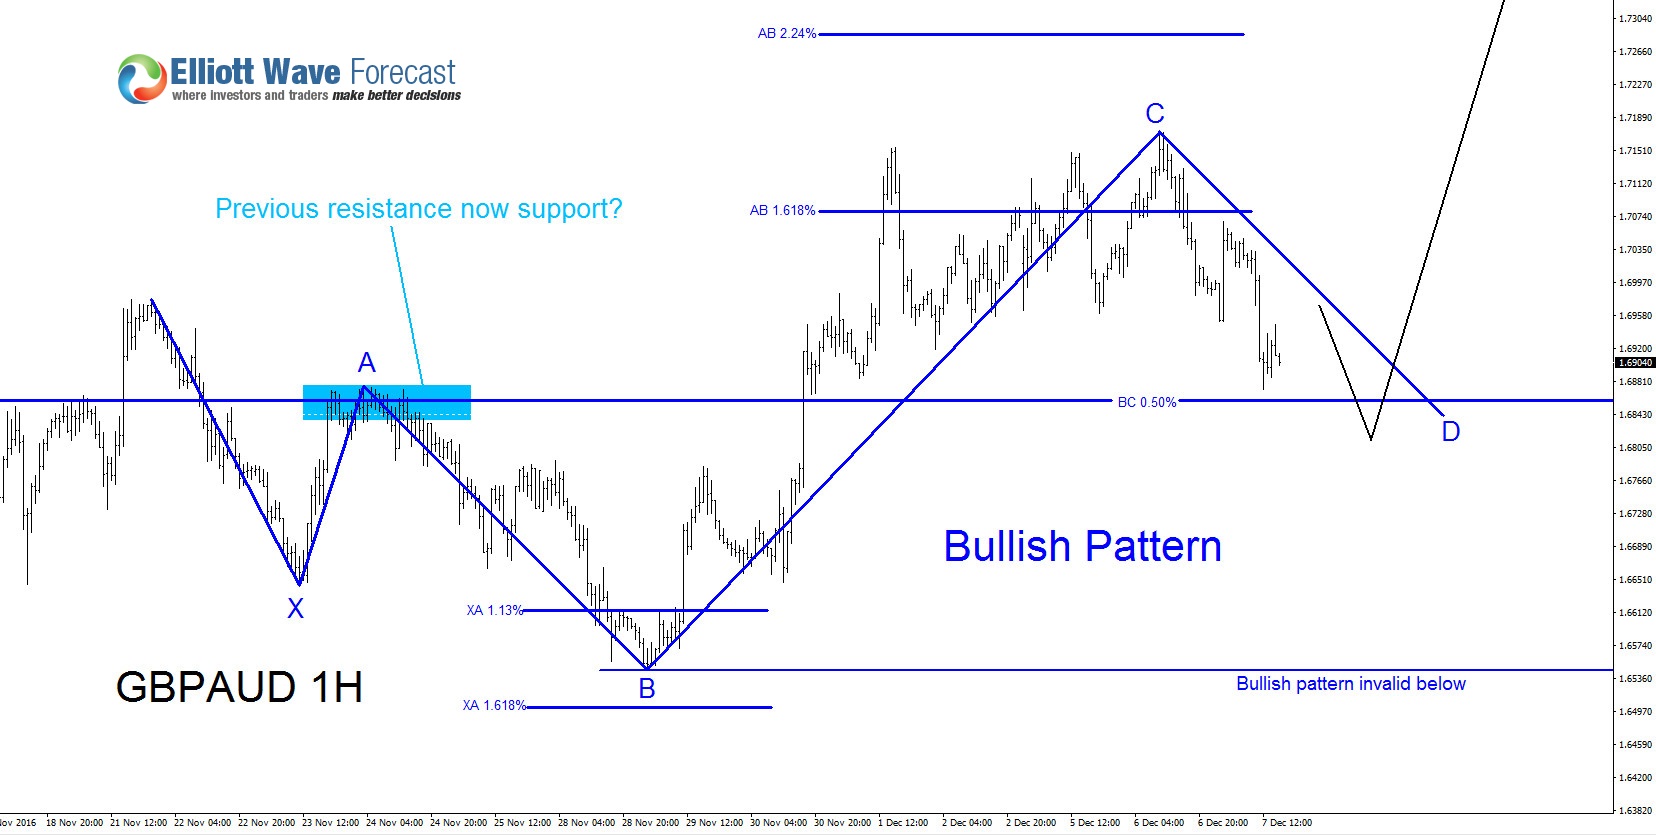

GBPAUD Elliott Wave Calling Possible Bounce Higher?
Read MoreGBPAUD has been trending higher on the 1 hour and 4 hour time frames since October 7/2016. Elliott Wave forecast analysis can also be calling for the pair to continue the trend and push higher. We at Elliottwave-Forecast always recommend our clients to trade with the trend and not against it. We also understand that […]
-

Will USDJPY Find Support and Continue Higher?
Read More*Forecast invalidated / Patterns invalidated* USDJPY is trending up on the 4 hour and 1 hour time frames so it is best to follow the trend and look for any possible bullish scenarios that shows USDJPY can continue higher. On the chart below we can see two possible bullish patterns (blue, red) with both BUY […]
-
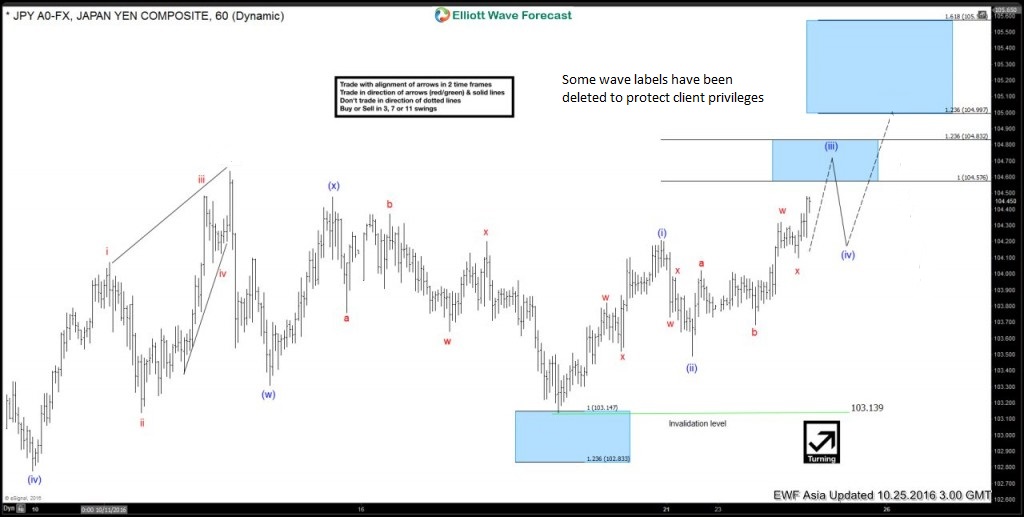
USDJPY : Elliott Waves Calling Bounce Higher
Read MoreAs traders, when we stare at charts everyday, there are times when the forecast of the market is crystal clear. The charts below, from our members area, demonstrates how clear we saw the path for USDJPY on October 18/2016. During the New York Mid-day update, we advised our clients that USDJPY will find support at […]
-

EURUSD: Three Possible Bullish Patterns
Read More*Forecast has been invalidated* EURUSD is at the moment in a bearish trend making lower lows and lower highs on the daily chart. But there are three bullish patterns that could stop this trend and possibly reverse EURUSD to move higher. All three bullish patterns trigger BUYS in the 1.0660 – 1.0560 zone. We have […]
-
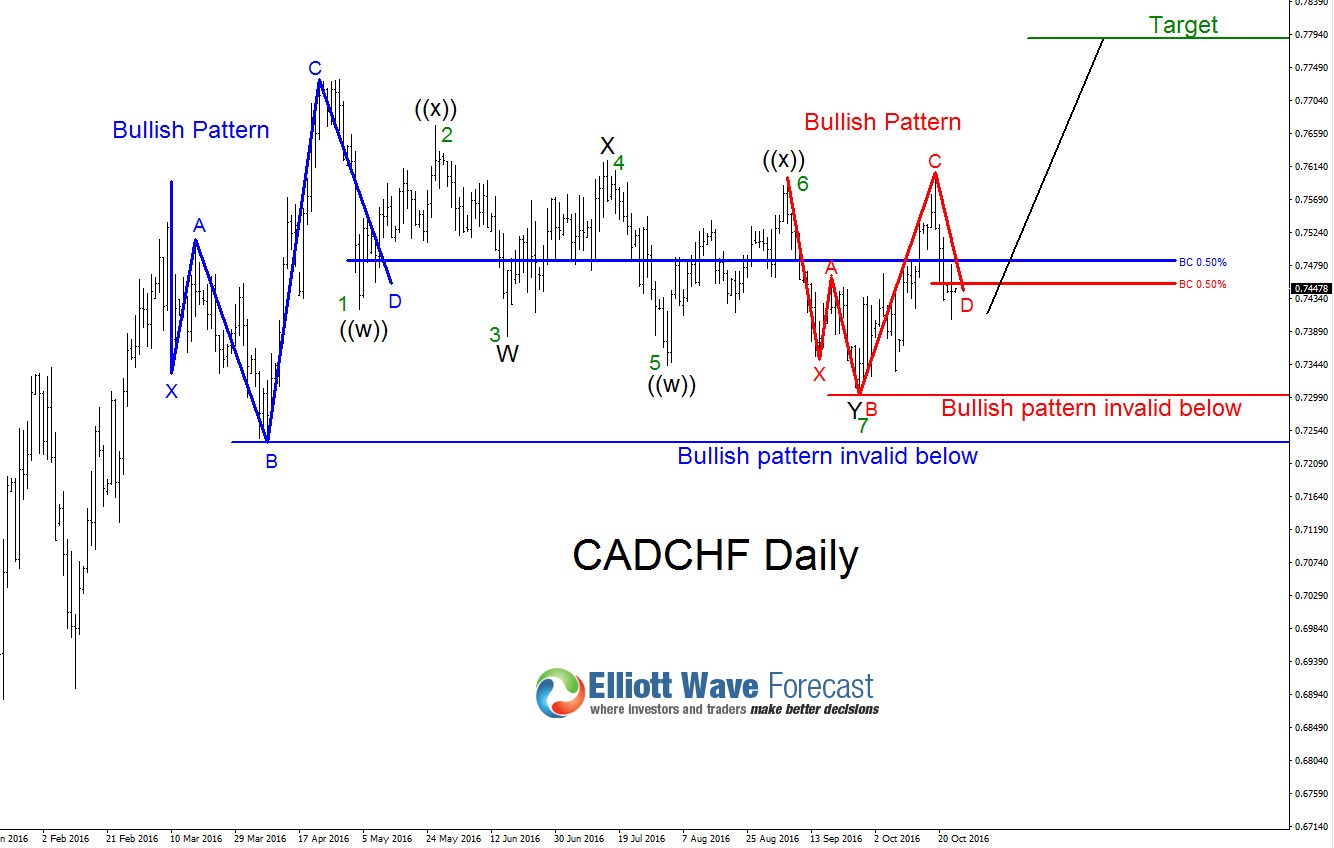
CADCHF: Possible 7 Swing WXY Elliott Wave Correction
Read More*Forecast has been invalidated* Since April 22/2016 CADCHF seems to be in a Elliott Wave corrective pattern. A 7 swing WXY Elliott Wave pattern can be seen and we at EWF always encourage to buy or sell corrections on the swings 3, 7, 11. CADCHF made a bounce on the 7th swing September 27/2016 and […]
-
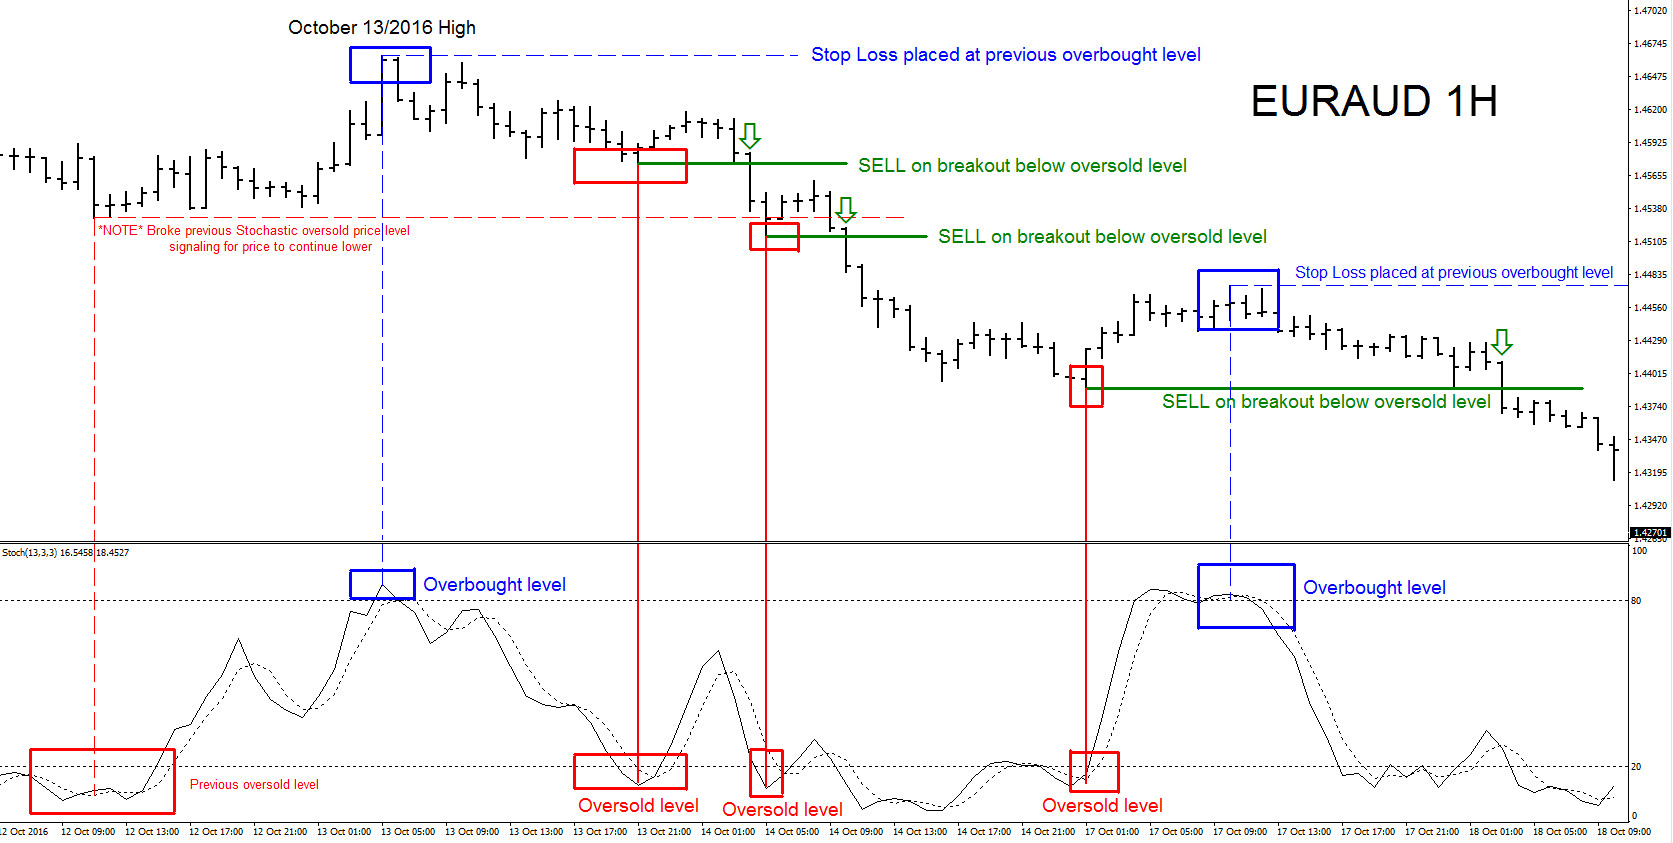
Trading Momentum Price Action Break-outs With an Elliott Wave Forecast
Read MoreOn October 13/2016, during our London update, we advised our members that EURAUD did a 3 swing correction pullback on the 1 hour chart and the pair can now continue lower. In the chart below, EURAUD saw rejection at the 0.50% Fibonacci retracement level and we clearly see a reaction from this Fib. level. Before entering […]