
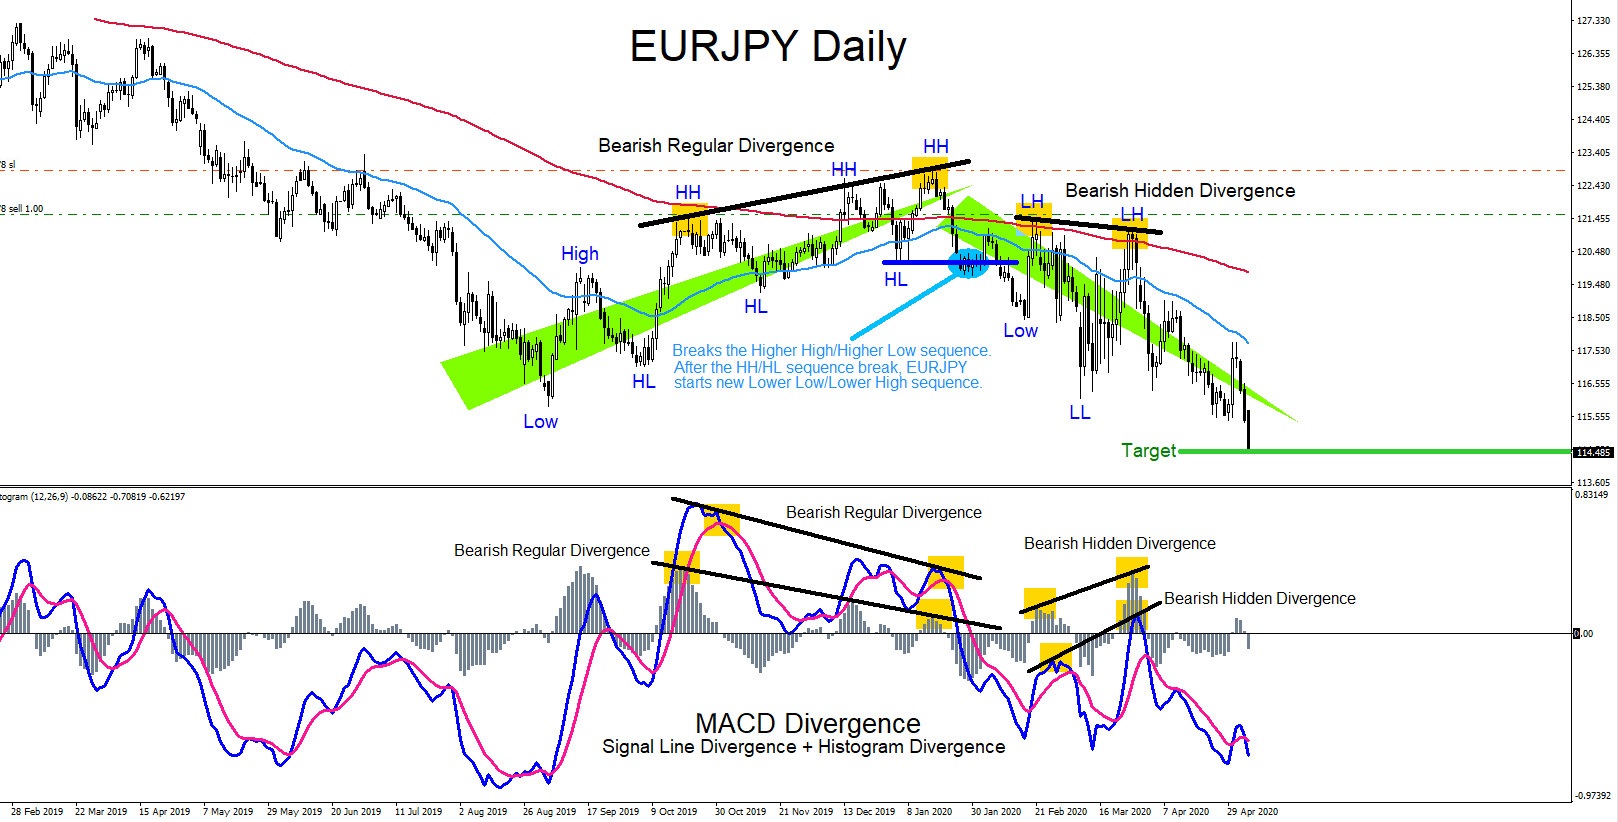
Divergence trading patterns can signal traders of possible trade setups. There are 2 types of divergence patterns, regular divergence and hidden divergence. Both patterns can signal a trader on which side to trade the market. A divergence pattern is when price is moving in one direction but the oscillator indicator is moving in a different direction. […]
-
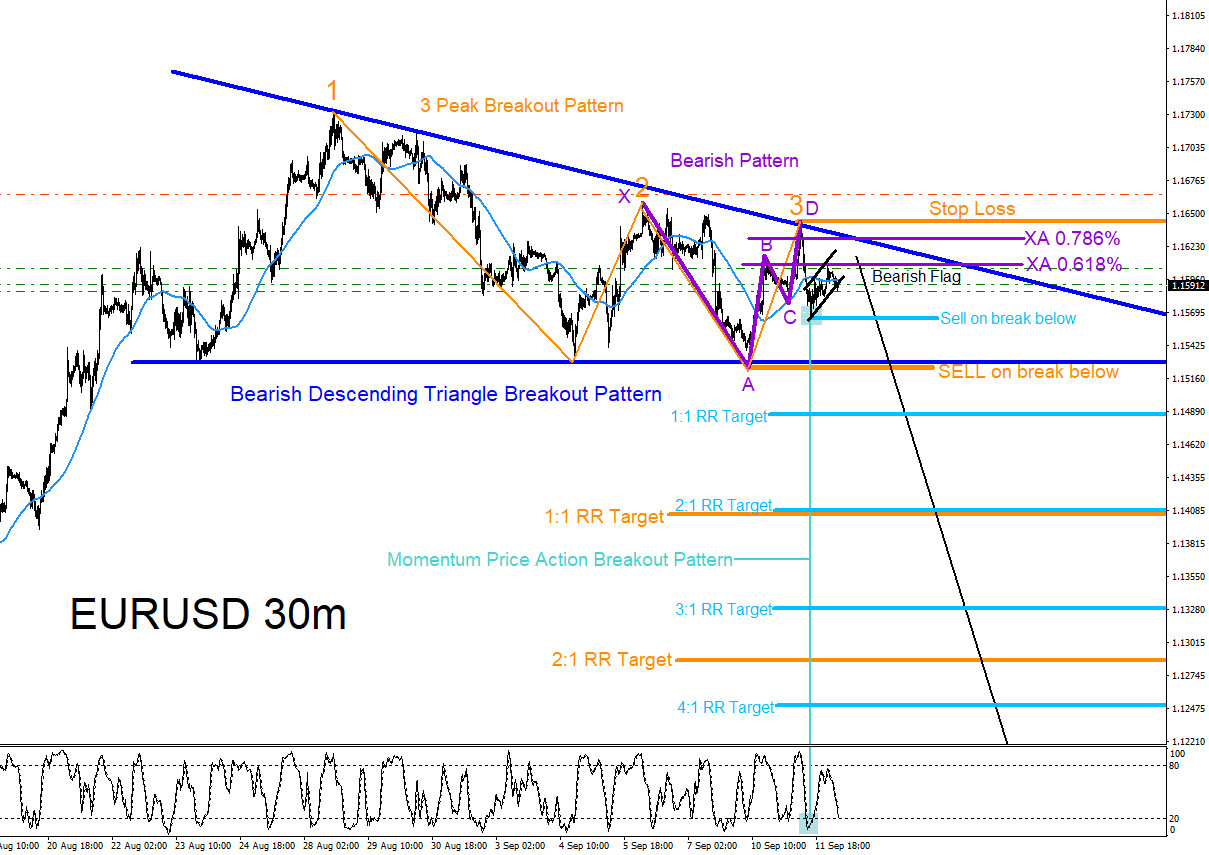

EURUSD : Expecting Move Lower
Read MoreEURUSD Technical Analysis September 12/2018 EURUSD Possible SELL/SHORT Trade Setup: On February 2018 EURUSD topped out, reversed lower and has been pushing lower since. Traders should continue to follow the trend and continue to look for possible signals for any selling opportunities. At the moment EURUSD is currently forming a possible Descending Bearish Triangle Breakout […]
-
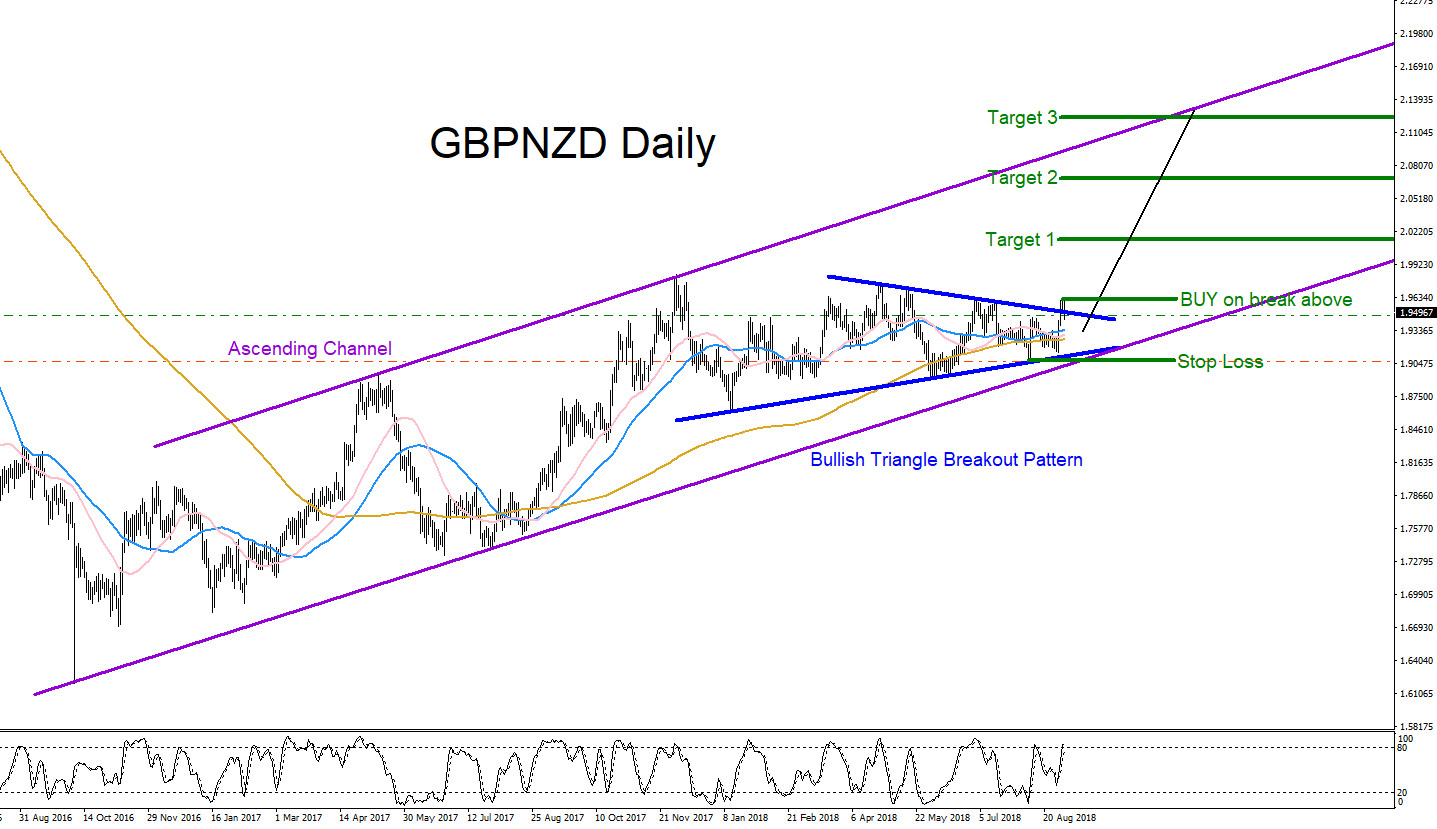
GBPNZD Going to Break Higher?
Read MoreGBPNZD Technical Analysis 9.3.2018 GBPNZD Possible BUY/LONG Trade Setup: Since October 2016 GBPNZD has been trending higher. Traders should continue to follow the trend and look for possible signals for any buying opportunities. At the moment the pair is currently forming a possible Bullish Triangle Breakout Pattern (Blue) on the Daily chart for another possible […]
-
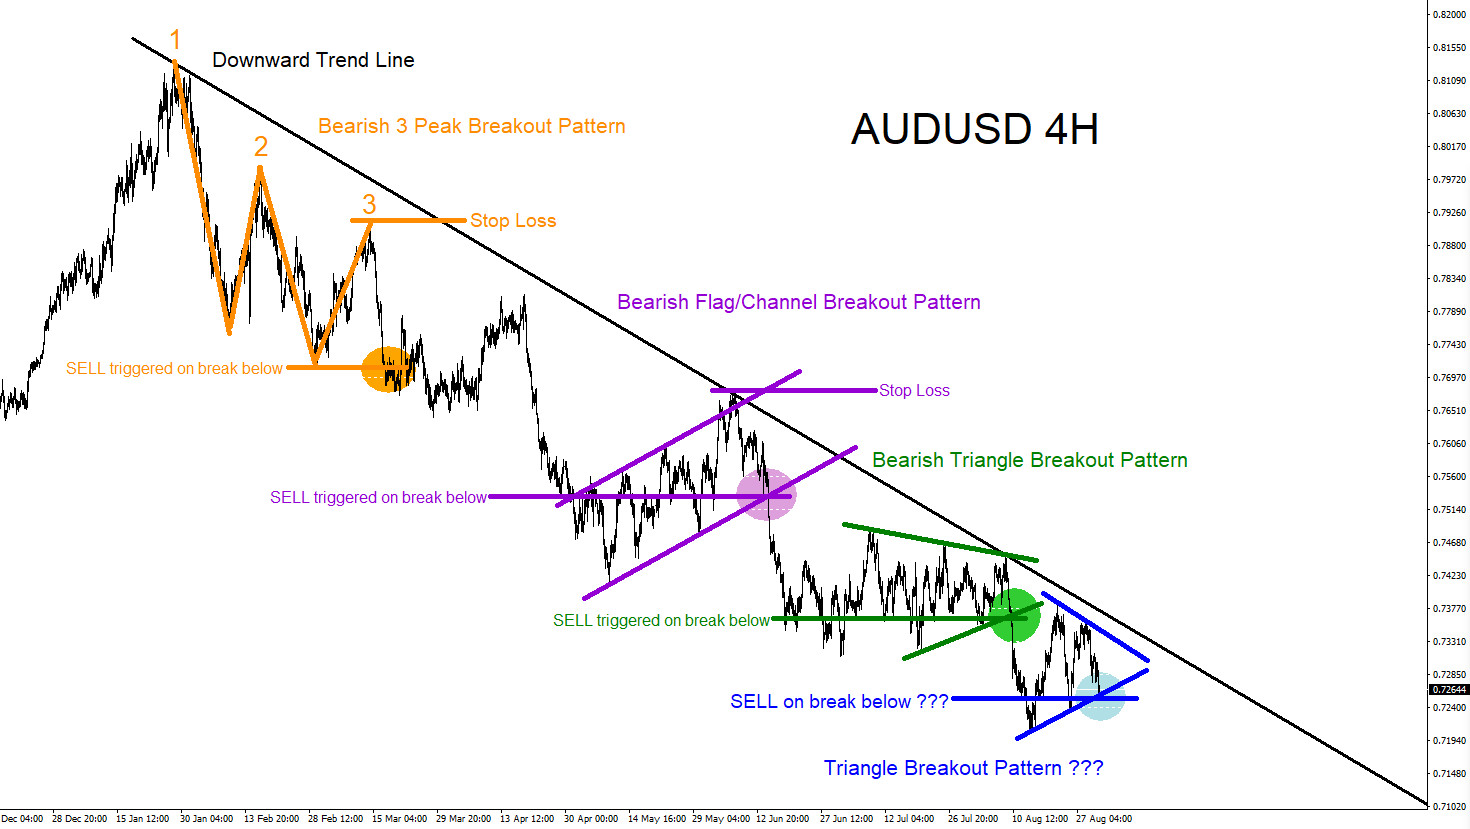
AUDUSD : Another Extension Lower?
Read MoreAUDUSD Technical Analysis 8.30.2018 AUDUSD Possible SELL/SHORT Trade Setup: Since January 2018 AUDUSD has been trending lower and there were various market bearish patterns that were signalling for the pair to move lower. Traders should continue to follow the trend and continue to look for possible signals for any selling opportunities. At the moment AUDUSD […]
-
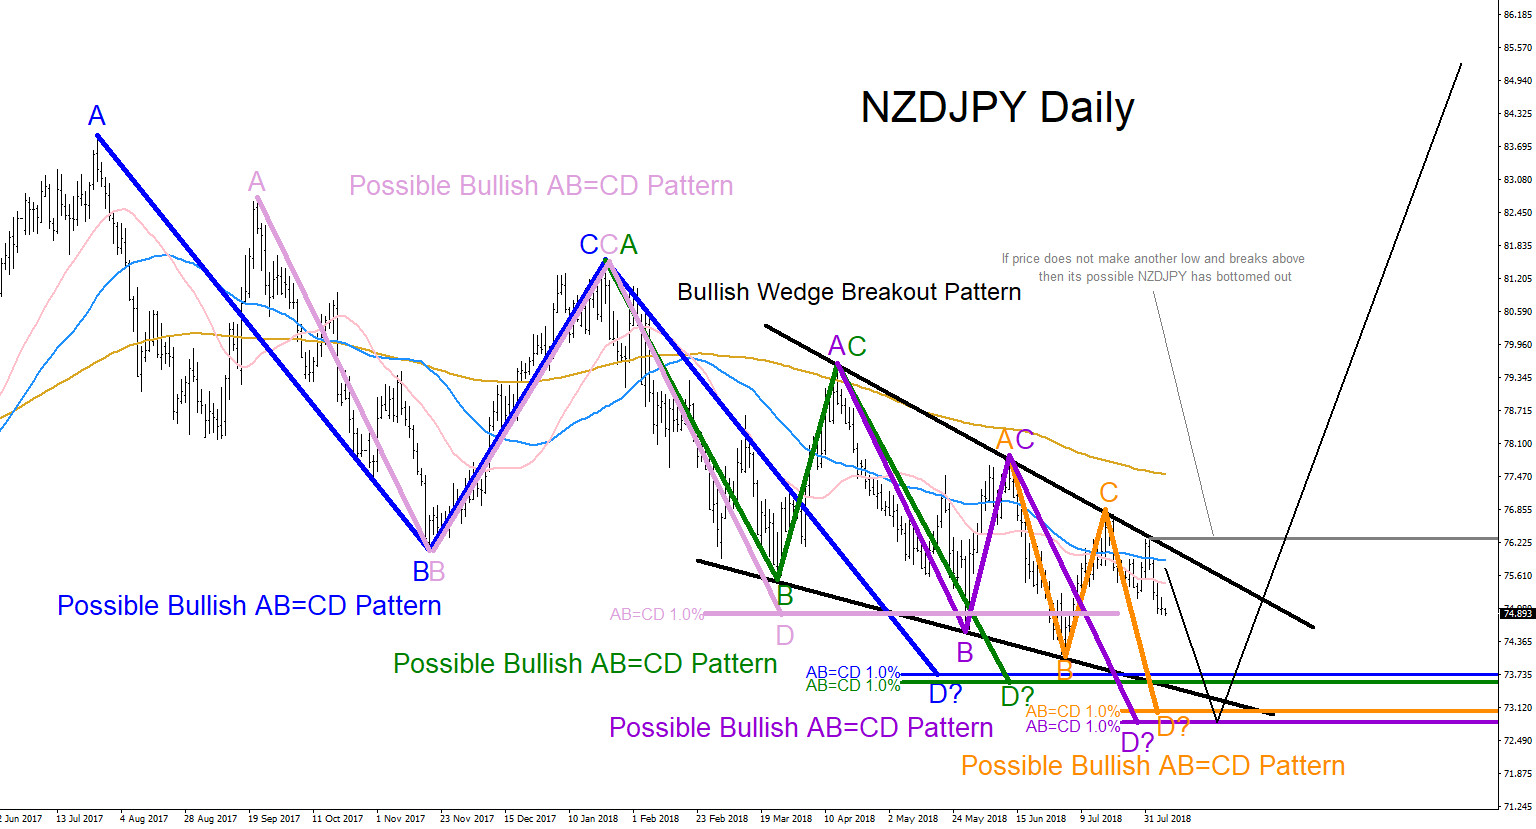
NZDJPY : AB=CD Equal Legs Pattern
Read MoreNZDJPY Technical Analysis August 7/2018 NZDJPY is on a lower low lower high sequence since July 27/2017. Looking at the Daily time frame chart we can clearly see a series of AB=CD bullish patterns which can possibly signal that a potential bounce higher can happen if the pair can hit the pattern reversal BUY trigger […]
-
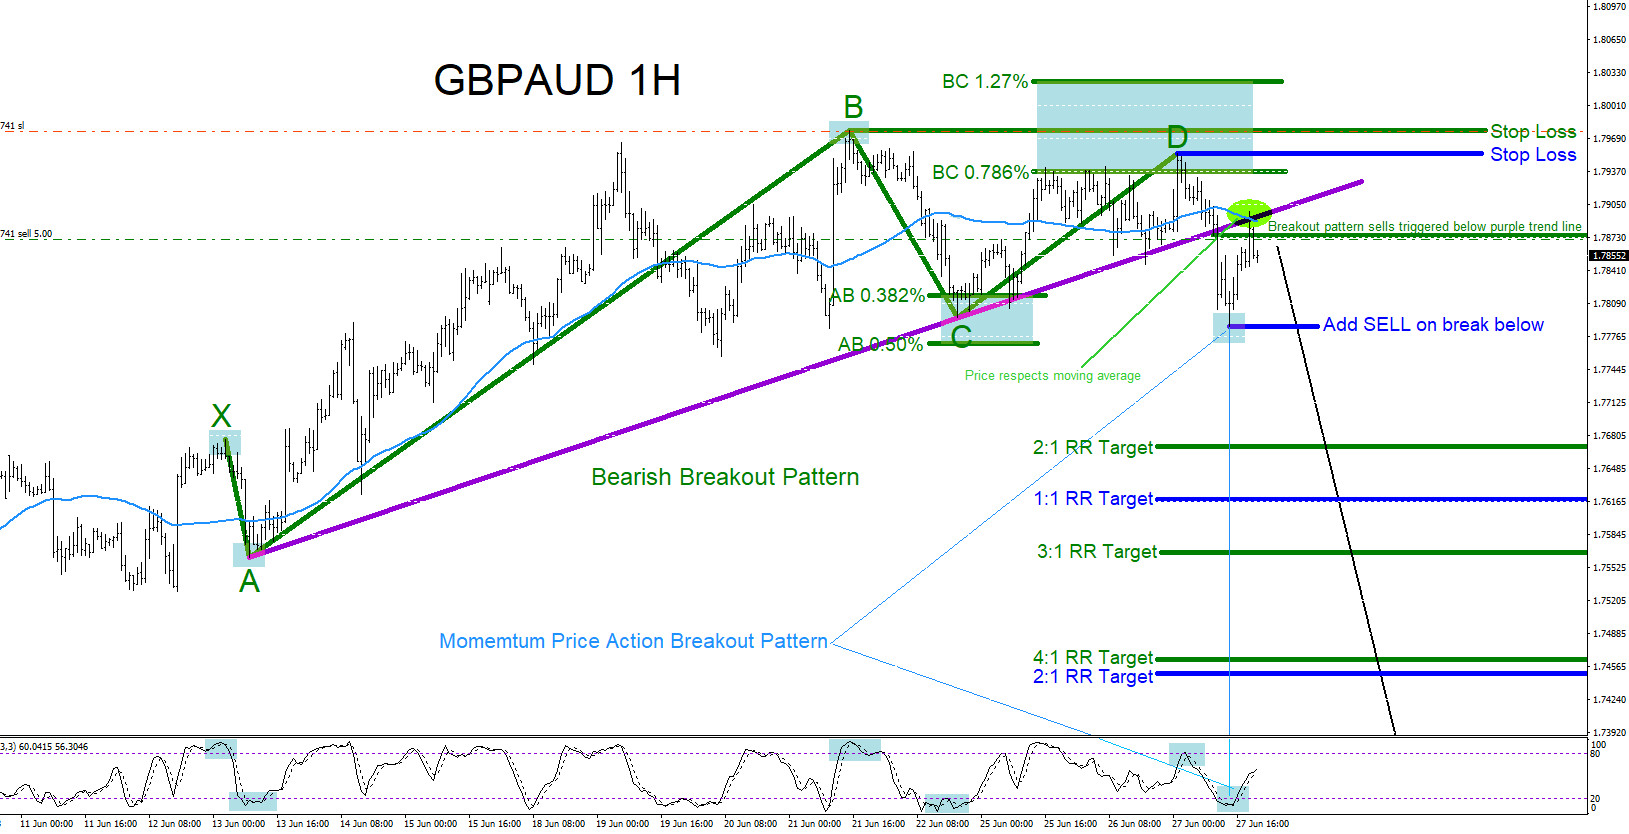
GBPAUD : Down Side Trade Set Up
Read MoreGBPAUD Technical Analysis 6.28.2018 GBPAUD Possible SELL/SHORT Trade Setup: GBPAUD on the 1 hour chart has broken out of a possible bearish pattern and a Momentum Price Action Breakout Pattern can be forming where bears can potentially push the pair lower. Traders should be watching to see if price respects the 50 Simple Moving Average […]
-
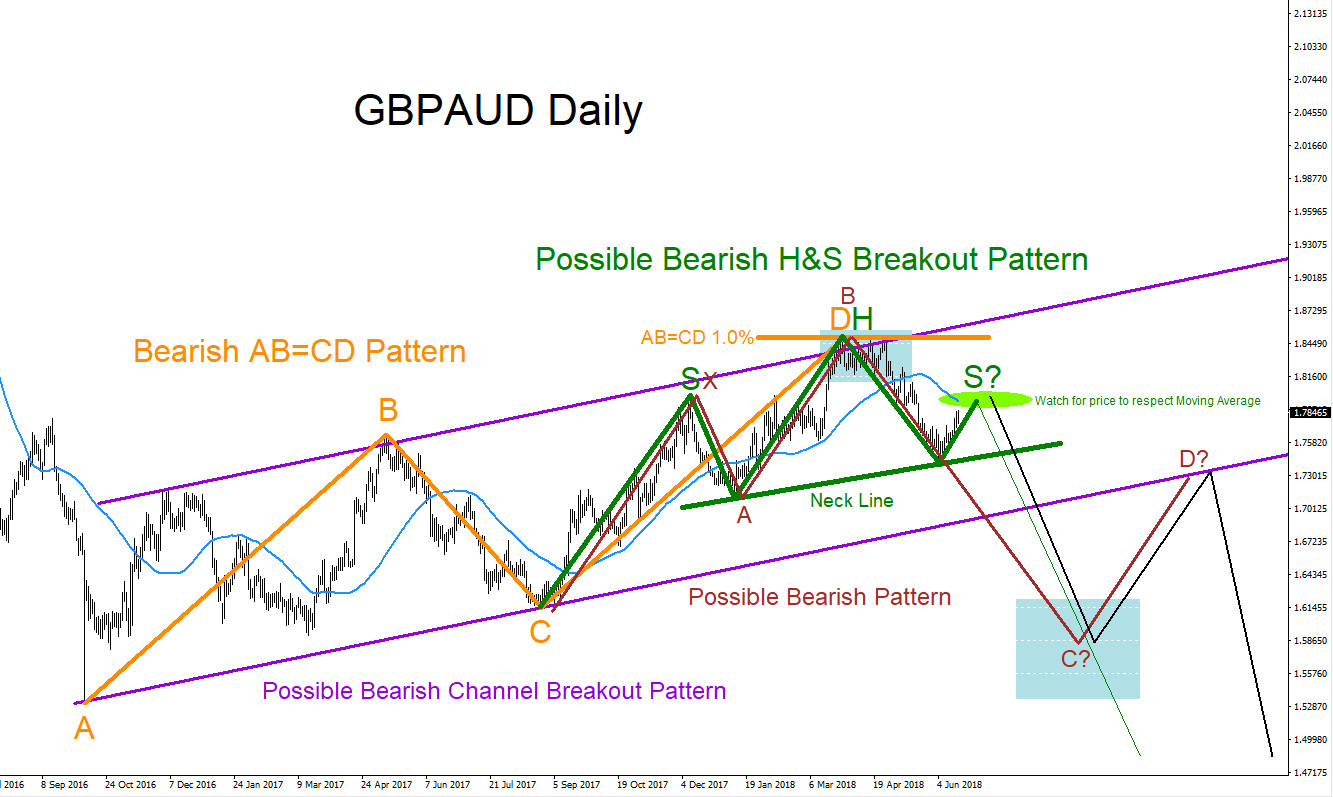
GBPAUD : Possible Bearish Scenario
Read MoreGBPAUD Technical Analysis June 18/2018 GBPAUD Possible SELL/SHORT Trade Setup: GBPAUD on the Daily chart has clear possible bearish patterns which can be signalling for a move lower in the coming days and weeks. Traders should be watching to see if price will respect the 50 Simple Moving Average (Turquoise) and reverse off lower in […]