

On April 18 2024 I posted on social media @AidanFX the EURJPY BUY setup chart. The pair was in an uptrend and price moved into the demand/buy zone (Blue) where the buy entry was triggered. EURJPY 4 Hour Chart April 18 2024 EURJPY 4 Hour Chart April 23 2024 Entered the BUY trade at 163.06 […]
-
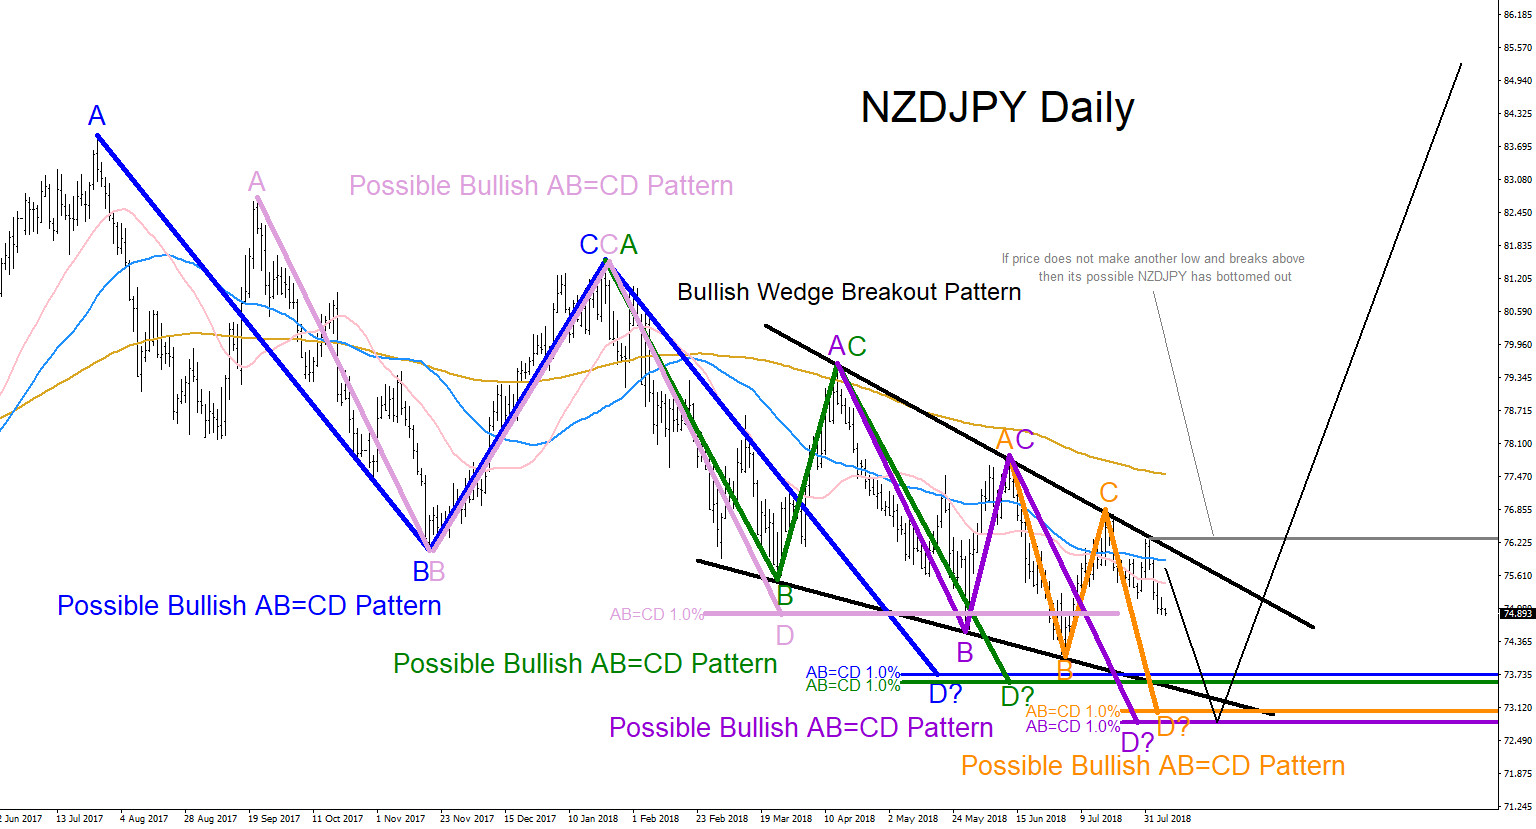

NZDJPY : AB=CD Equal Legs Pattern
Read MoreNZDJPY Technical Analysis August 7/2018 NZDJPY is on a lower low lower high sequence since July 27/2017. Looking at the Daily time frame chart we can clearly see a series of AB=CD bullish patterns which can possibly signal that a potential bounce higher can happen if the pair can hit the pattern reversal BUY trigger […]
-
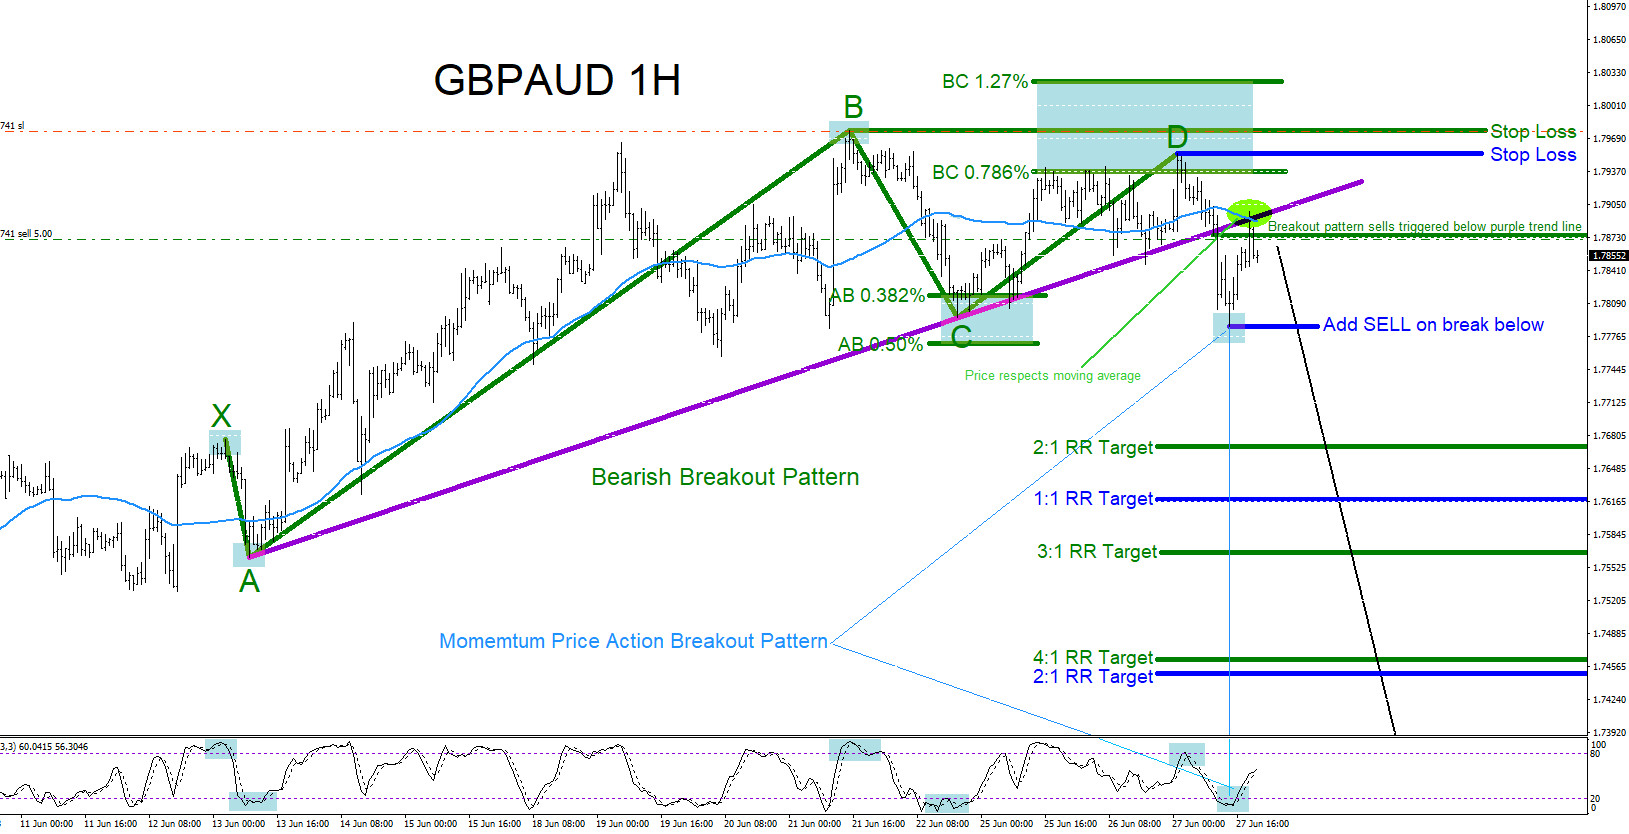
GBPAUD : Down Side Trade Set Up
Read MoreGBPAUD Technical Analysis 6.28.2018 GBPAUD Possible SELL/SHORT Trade Setup: GBPAUD on the 1 hour chart has broken out of a possible bearish pattern and a Momentum Price Action Breakout Pattern can be forming where bears can potentially push the pair lower. Traders should be watching to see if price respects the 50 Simple Moving Average […]
-
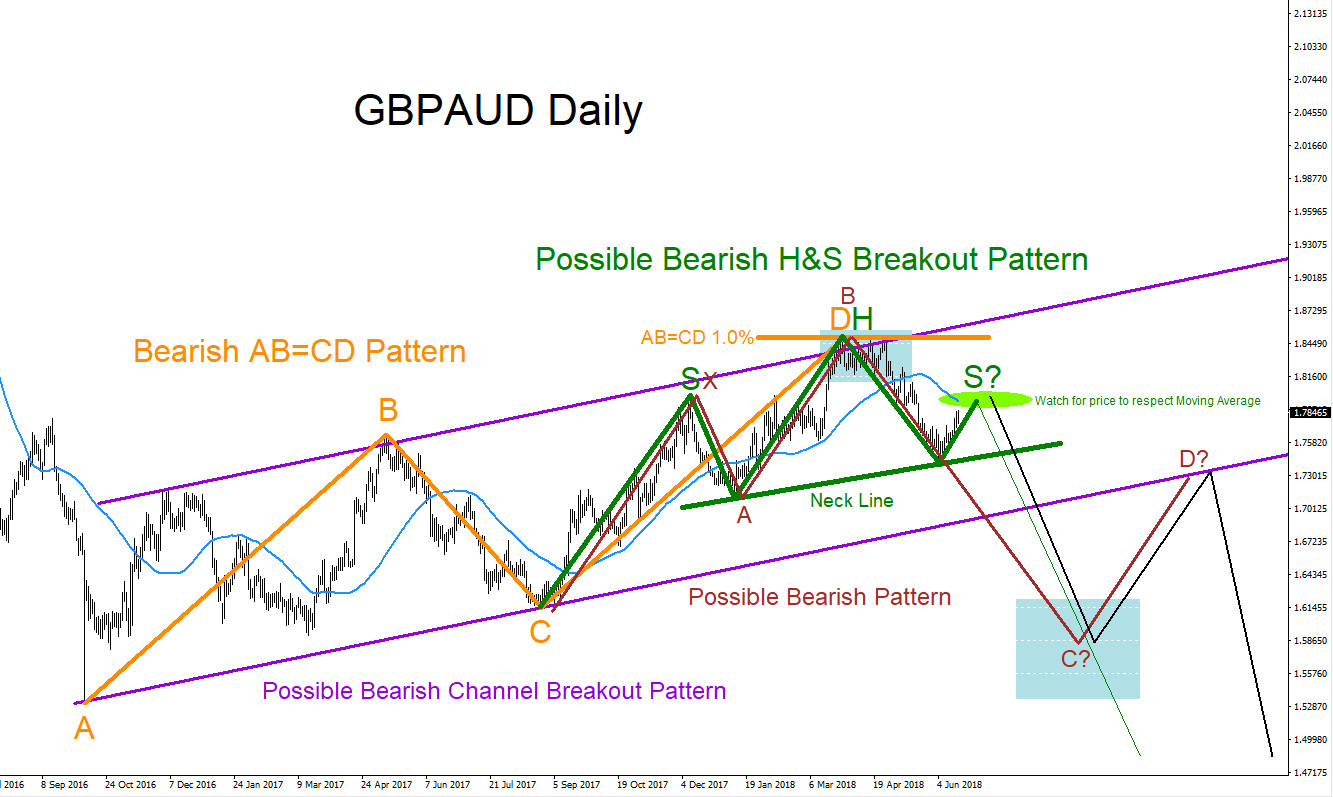
GBPAUD : Possible Bearish Scenario
Read MoreGBPAUD Technical Analysis June 18/2018 GBPAUD Possible SELL/SHORT Trade Setup: GBPAUD on the Daily chart has clear possible bearish patterns which can be signalling for a move lower in the coming days and weeks. Traders should be watching to see if price will respect the 50 Simple Moving Average (Turquoise) and reverse off lower in […]
-
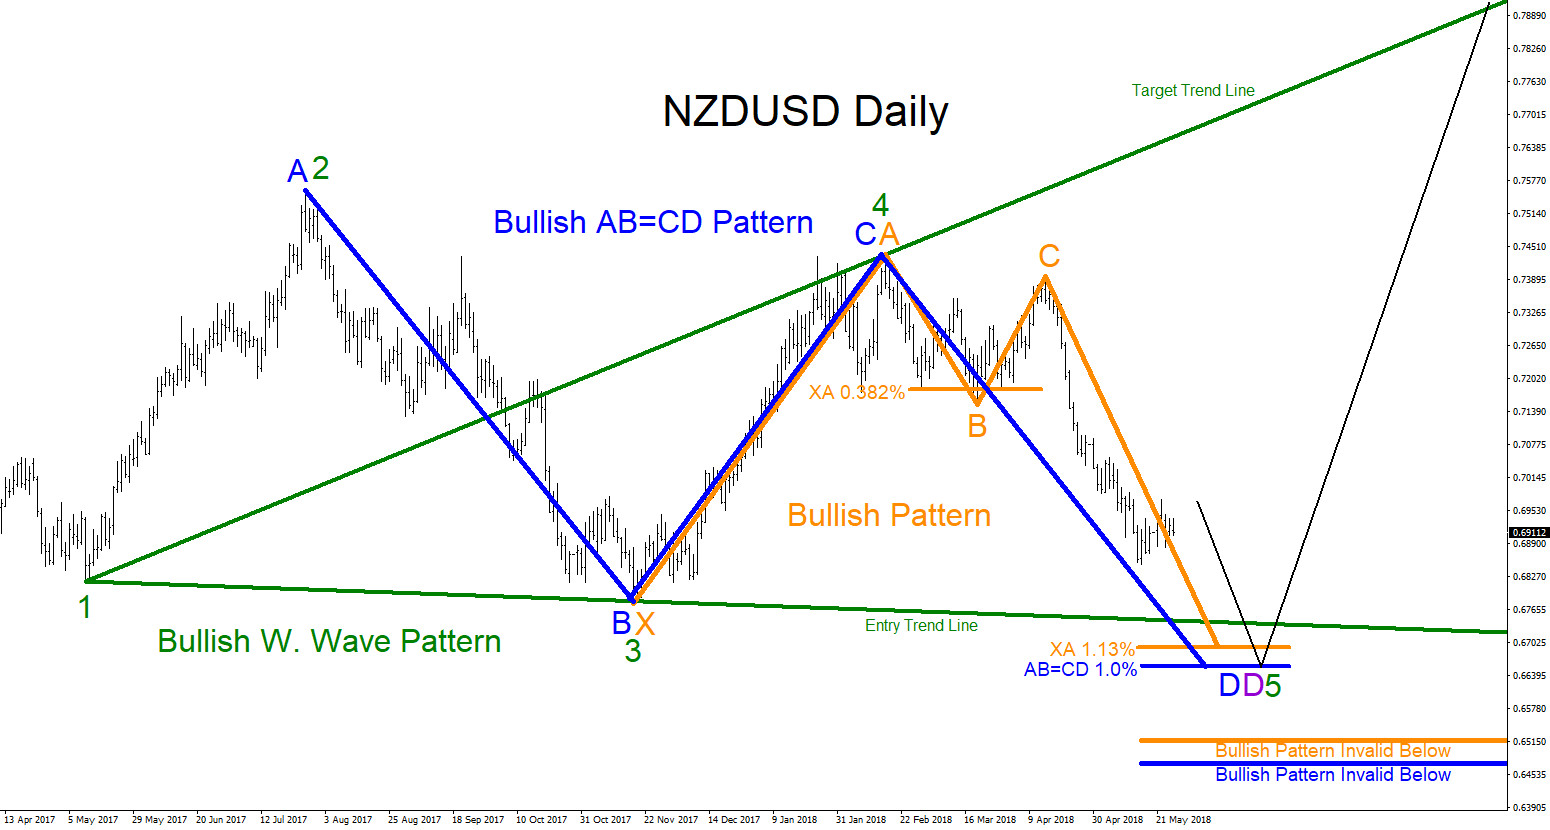
NZDUSD : Possible Reversal Higher?
Read MoreNZDUSD Technical Analysis 5.25.2018 NZDUSD at the current moment looks to be in a 3 swing move lower (Daily chart) starting from the July 27/2017 highs. Expect price to continue lower and break below the November 17/2017 lows. If breaks lower, the next level of interest where NZDUSD can find support and possibly reverse and […]
-
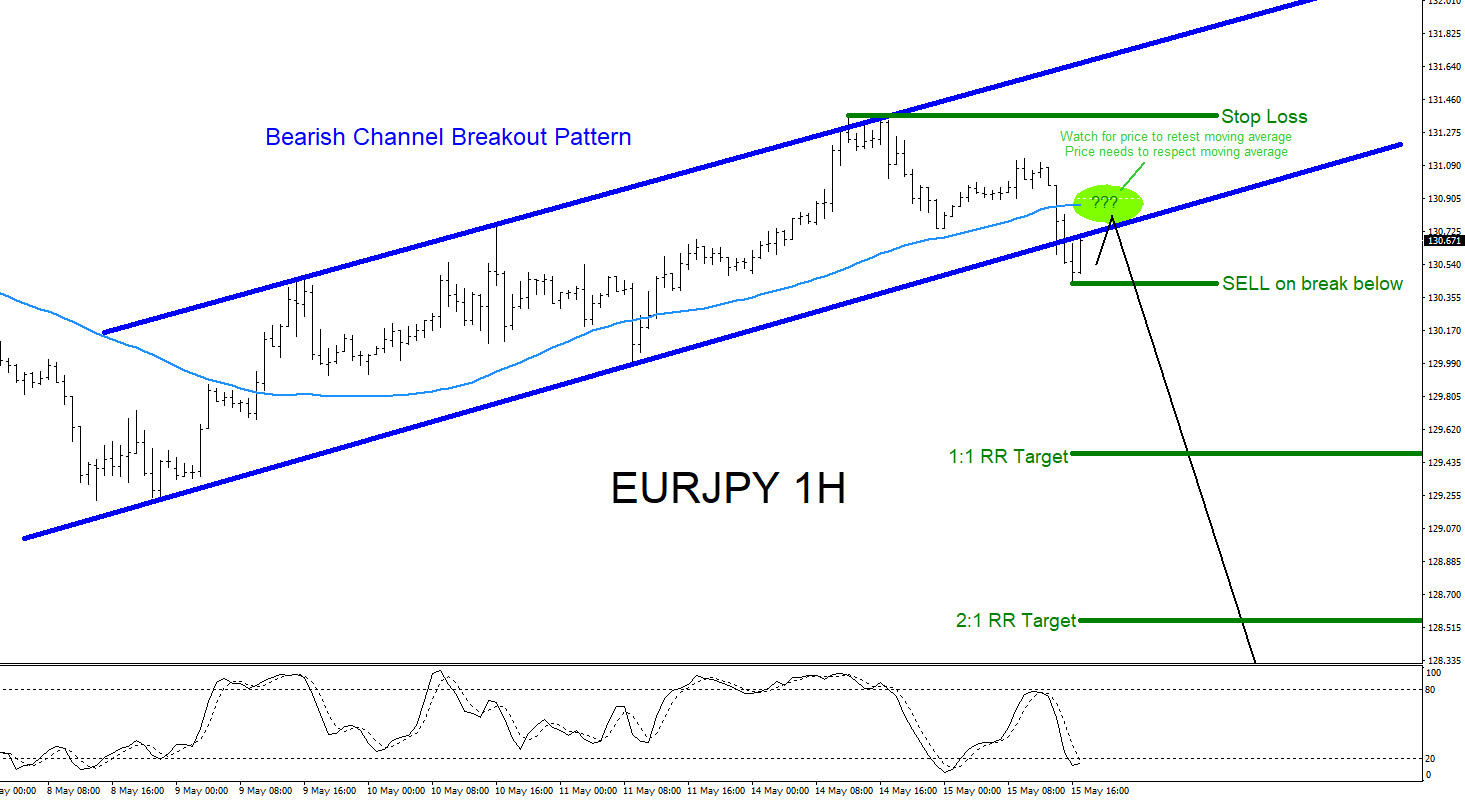
EURJPY : Will Bears Push the Pair Lower?
Read MoreEURJPY Technical Analysis 5.16.2018 EURJPY Possible SELL/SHORT Trade Setup: EURJPY on the 1 hour chart is breaking out of a possible bearish channel pattern and a Momentum Price Action Breakout Pattern can be forming where bears can potentially push the pair lower. Traders should be watching to see a retest and also watch to see […]
-
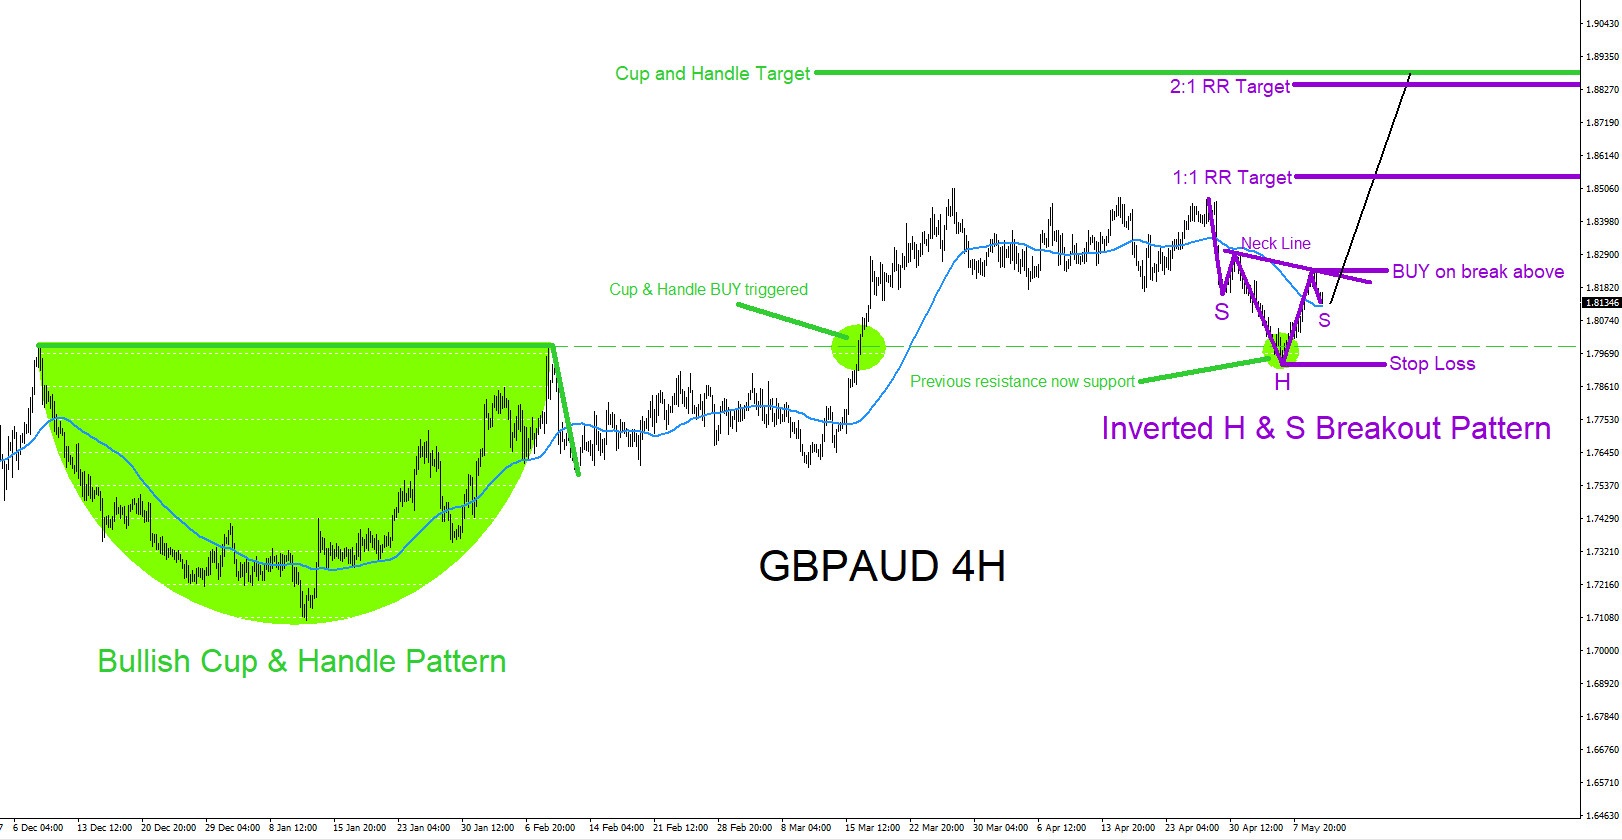
GBPAUD : Eyeing the Possible Breakout Higher
Read MoreGBPAUD Technical Analysis 5.10.2018 GBPAUD Possible BUY/LONG Trade Setup: GBPAUD is forming a possible bullish inverted Head and Shoulders pattern (Purple). Traders should watch for a good strong break above the purple BUY breakout trend line. A good break above this level will send GBPAUD higher and can extend possibly to newer highs above the March […]