

On April 18 2024 I posted on social media @AidanFX the EURJPY BUY setup chart. The pair was in an uptrend and price moved into the demand/buy zone (Blue) where the buy entry was triggered. EURJPY 4 Hour Chart April 18 2024 EURJPY 4 Hour Chart April 23 2024 Entered the BUY trade at 163.06 […]
-
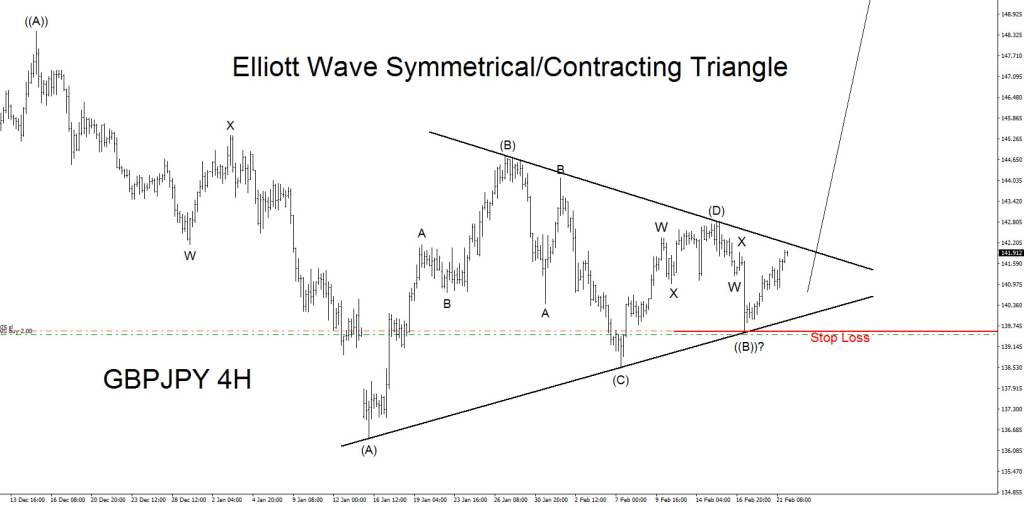

GBPJPY Elliott Wave Bullish Triangle Scenarios
Read More*** Triangle scenarios have been invalidated *** GBPJPY Technical Analysis February 21/2017 – Triangle Idea Traders should remain bullish as long as GBPJPY stays above the 138.51 level. Below we will show three possible Elliott Wave triangle bullish patterns. GBPJPY has bounced higher since October 2016 and the possibility of the pair continuing higher will […]
-

GBPJPY Bullish Trend Starting? Part 2
Read MoreGBPJPY Technical Analysis February 10/2017 To view GBPJPY Bullish Trend Starting? Part 1 published January 19/2017 click here > Part 1 GBPJPY 4 Hour Bullish Pattern : On the 4 hour chart we can see a Bullish Pattern (Red) triggered at the BC 0.50% Fib. retracement level where it has since bounced higher. A strong breakout […]
-
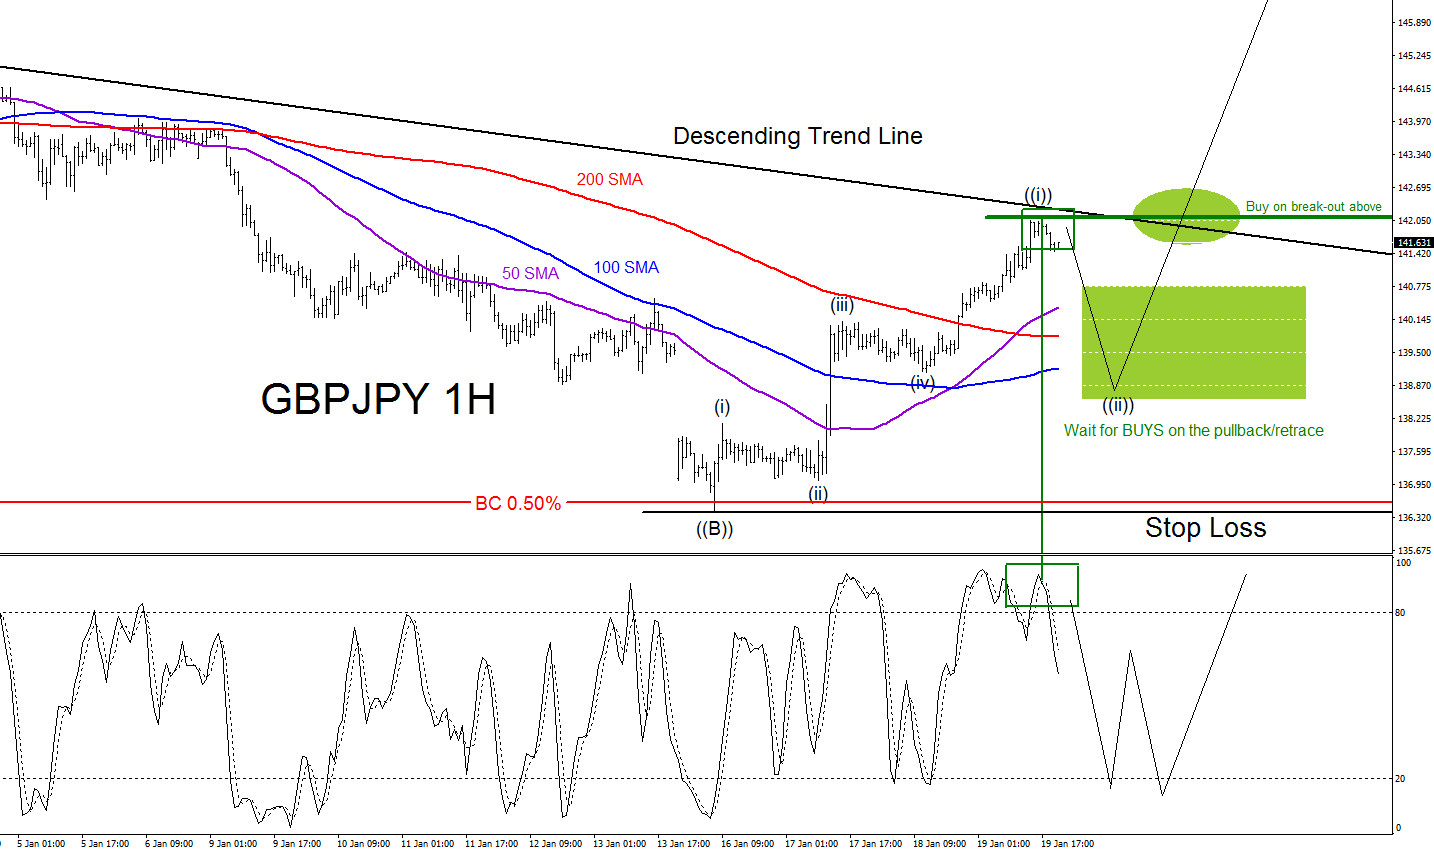
GBPJPY Bullish Trend Starting?
Read MoreGBPJPY Technical Analysis January 19/2017 GBPJPY 4 Hour Bullish Pattern : In the chart below a Bullish Pattern (Red) buy signal has already been triggered at the BC 0.50% Fib. level and price has since bounced higher. We are expecting for the pair to continue higher and break above the descending trend line signalling that a […]
-
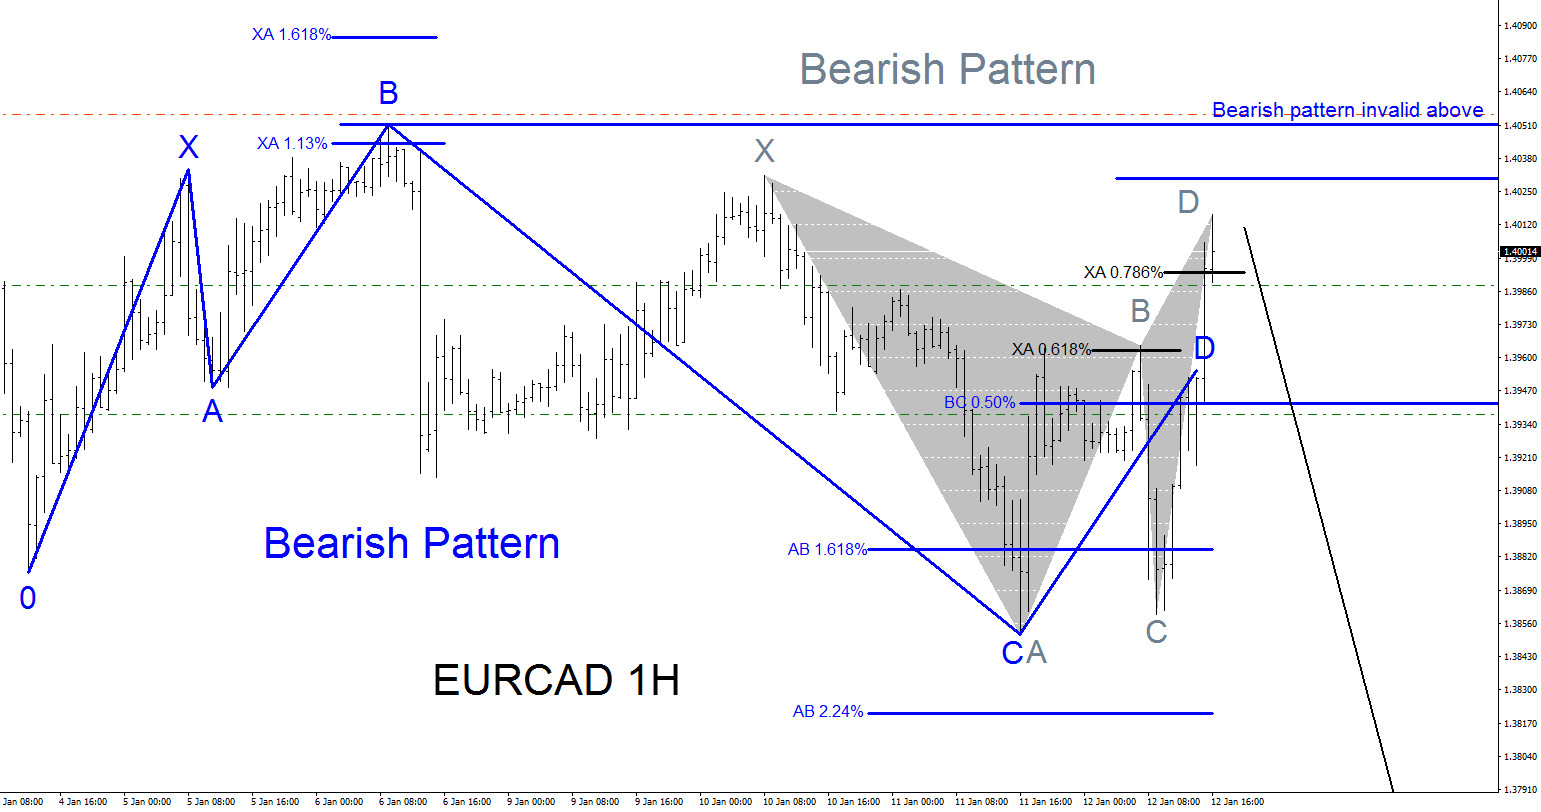
EURCAD Elliott Wave Plus Bearish Patterns
Read More*Forecast invalidated / Patterns invalidated* EURCAD Technical Analysis January 12/2017 EURCAD 1 hour Elliott Wave count can be calling for more downside and also there are two possible bearish patterns to match the bearish Elliott Wave count. As long as the pair stays below 1.4055 we can expect the pair to continue lower. Both the […]
-
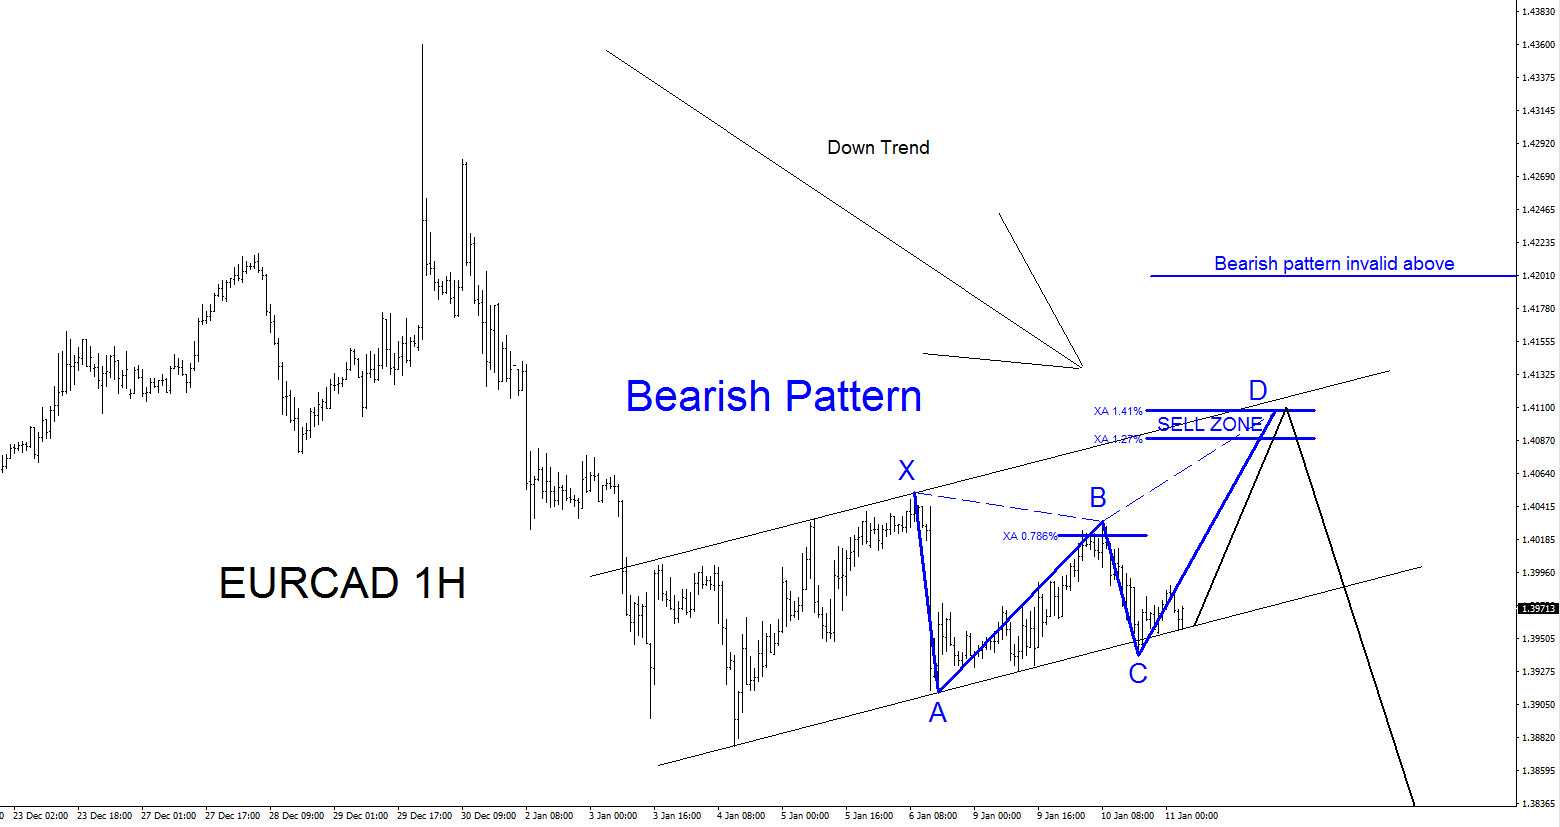
EURCAD Technical Analysis January 11 2017
Read More*Forecast invalidated / Patterns invalidated* EURCAD trend on the weekly and daily chart is bearish so traders should continue to look for selling opportunities and expect the pair to continue lower until a clear trend change shows that the down cycle is over. We at Elliott Wave Forecast always advise our members to always trade […]
-
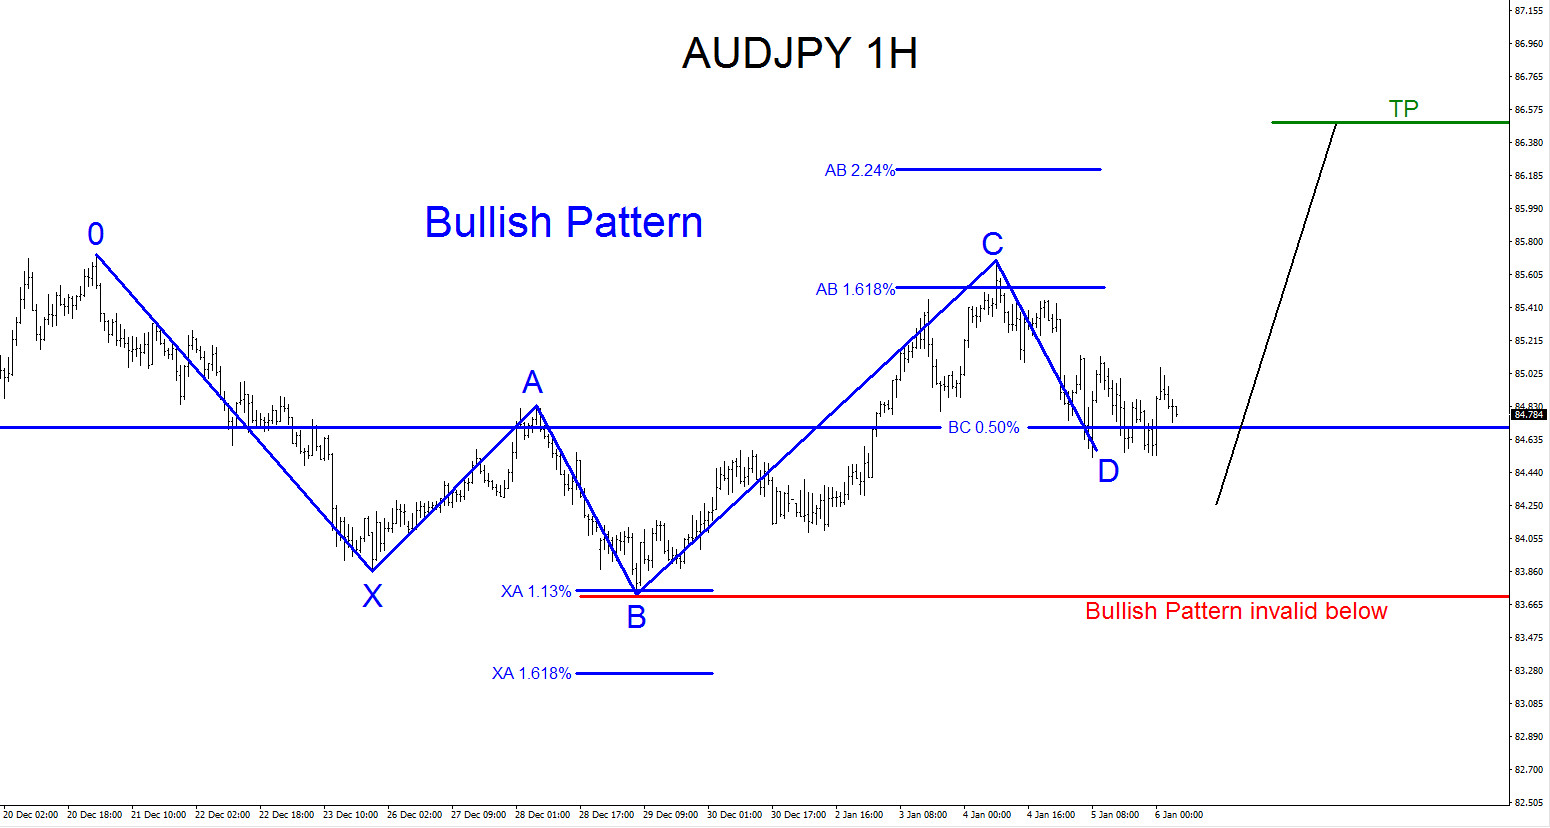
AUDJPY Elliott Wave Count & Bullish Pattern?
Read MoreAUDJPY Technical Analysis: Elliott Wave count on the 1 hour chart calling for possible move higher together with a bullish pattern (blue) also calling for move higher. Both the Elliott Wave count and blue bullish pattern invalidates at the 83.71 level. As long as the pair stays above 83.71 we can expect it to extend higher. AUDJPY […]