GBPJPY Technical Analysis February 10/2017
To view GBPJPY Bullish Trend Starting? Part 1 published January 19/2017 click here > Part 1
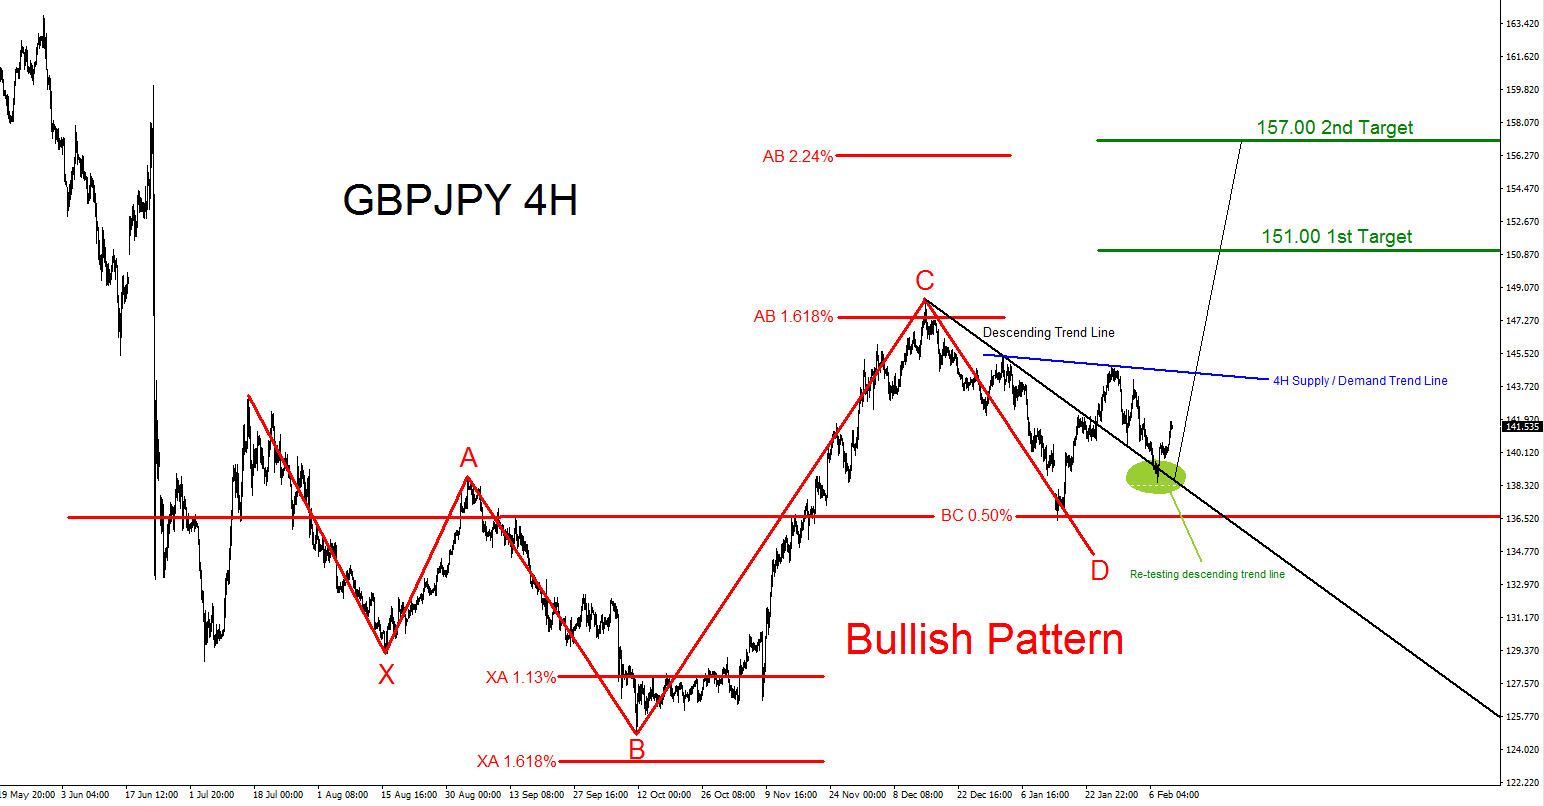
GBPJPY 4 Hour Bullish Pattern : On the 4 hour chart we can see a Bullish Pattern (Red) triggered at the BC 0.50% Fib. retracement level where it has since bounced higher. A strong breakout and candle close above the 4 hour Supply/Demand trend line (Blue) can signal that the pair will continue higher. Traders should watch for this confirmation.
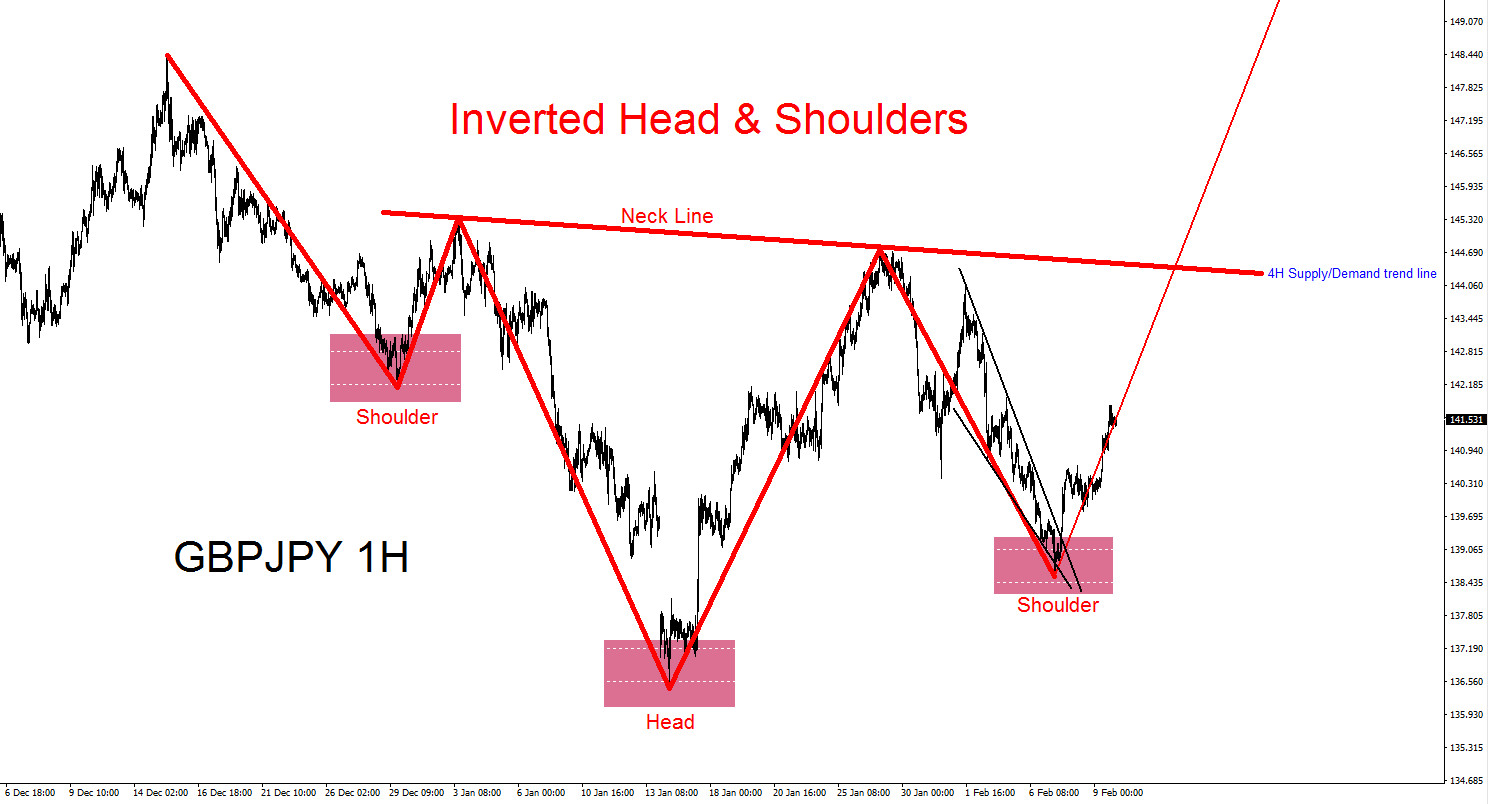
GBPJPY 1 Hour Bullish Inverted Head and Shoulders Pattern : Chart below we can see another bullish pattern (Red). An inverted head and shoulders pattern can be visible and triggers when price breaks above the neck line. The neck line is the same as the 4 hour supply/demand trend line (Blue) on the chart above. Bulls will be waiting for this breakout.
GBPJPY 1 Hour Price Action Break-out : Traders need to wait for a good breakout and candle close above 142.35. A price action momentum breakout (Green) above this level can push the pair to continue higher. Only a strong breakout above 144.77 and a candle close above the 4 hour supply/demand trend line will confirm the uptrend has resumed. Also watch for the 50 moving average (Purple) to cross above the 100 (Blue) and 200 (Red) moving averages to add more confirmation. To get a better explanation on Price Action Momentum Breakouts click here > Breakouts

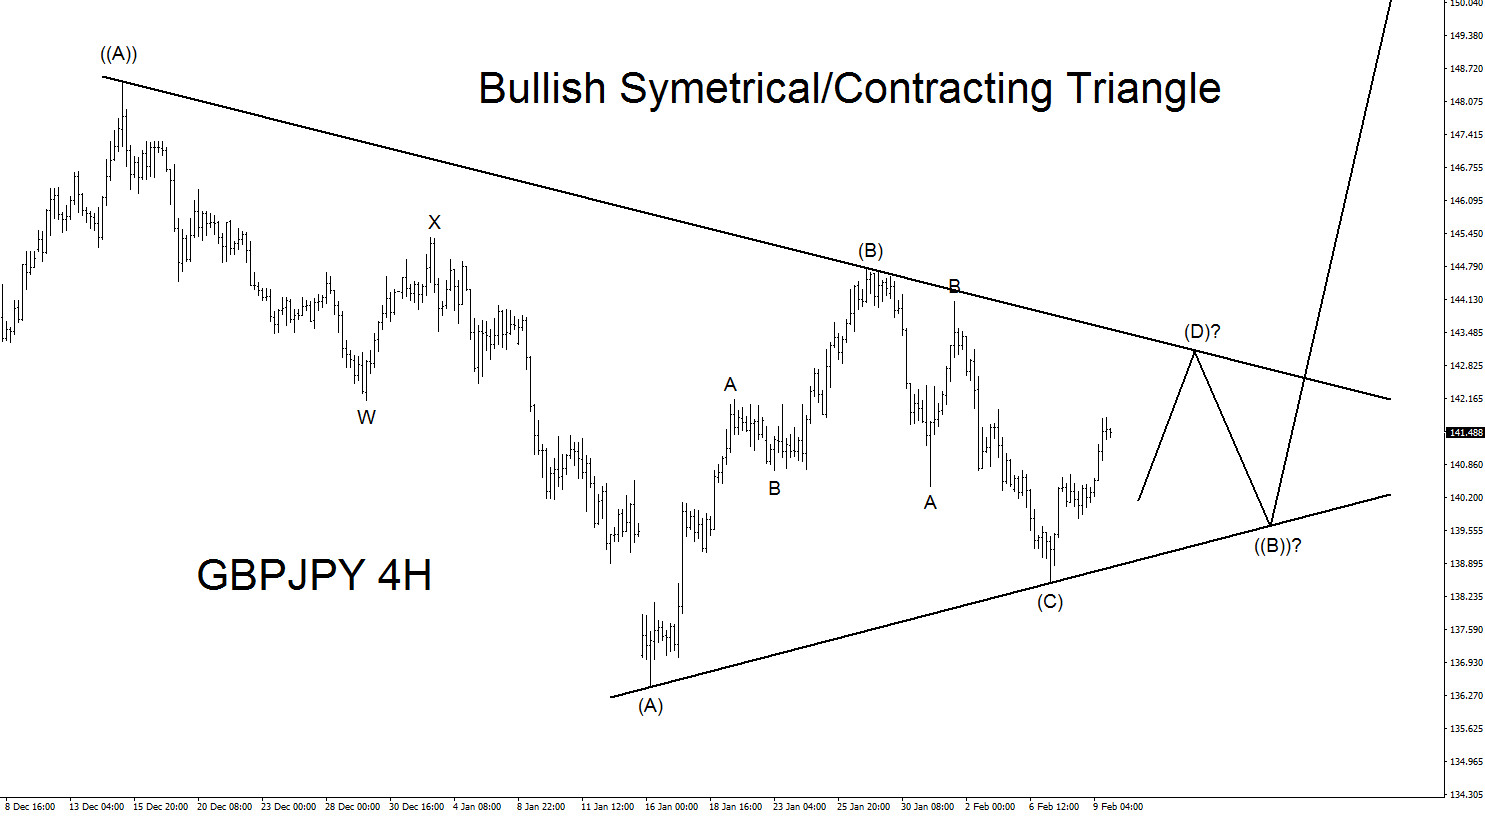
GBPJPY 4 hour Elliott Wave Triangle : If price action stalls and does not break above the 4 hour supply/demand trend line (Neckline) then its possible it can be doing an Elliott Wave triangle structure. As long as price stays above the wave (C) low this bullish triangle scenario can happen and break-out higher.
GBPJPY 4 hour Elliott Wave Double Correction : If the Elliott Wave triangle structure invalidates and breaks lower then traders can watch for a double correction (W-X-Y) structure towards the 132.75 – 129.90 area for the next possible bounce zone. There is also another possible bullish pattern (Red) that triggers a BUY signal at the XA 1.618% Fib. level.

Of course, like any strategy/technique, there will be times when the strategy/technique fails so proper money/risk management should always be used on every trade. Hope you enjoyed this article and follow me on Twitter > @AidanFX if you have any questions
*** Always use proper risk/money management according to your account size ***
Subscribe !!! Become an EWF member and get access FREE to our Live Trading Room > Click and get access
At Elliottwave-Forecast we cover 52 instruments (Forex, Commodities, Indices) in 4 different timeframes and we offer 3 Live Session Webinars everyday. We do Daily Technical Videos, Elliott Wave Trade Setup Videos and we have a 24 Chat Room. Our clients are always in the loop for the next market move.
Try Elliottwave-Forecast for 14 days FREE !!! Just click here –> 14 day FREE trial


