

In financial markets and quantitative trading, maximizing your profitability ratio—such as the Profit Factor, Return on Risk (RoR), or the Win/Loss ratio—requires an exceptional ability to differentiate between a temporary market pause and a total trend reversal.
One of the most powerful analytical frameworks used by institutional traders to achieve this is the WXY corrective structure. Derived from advanced Elliott Wave Theory, the WXY structure represents a complex, double-three corrective pattern. When properly integrated into a trading strategy, it drastically reduces risk exposure and maximizes profit efficiency.
Here is an analysis of how the WXY structure operates and why its execution fundamentally increases your financial profitability ratios.
Understanding the WXY Structure
A standard market correction usually follows a simple A-B-C three-wave pattern. However, when the market requires more time or price modification to digest a prior massive trend, it forms a WXY structure (also known as a Double Three).
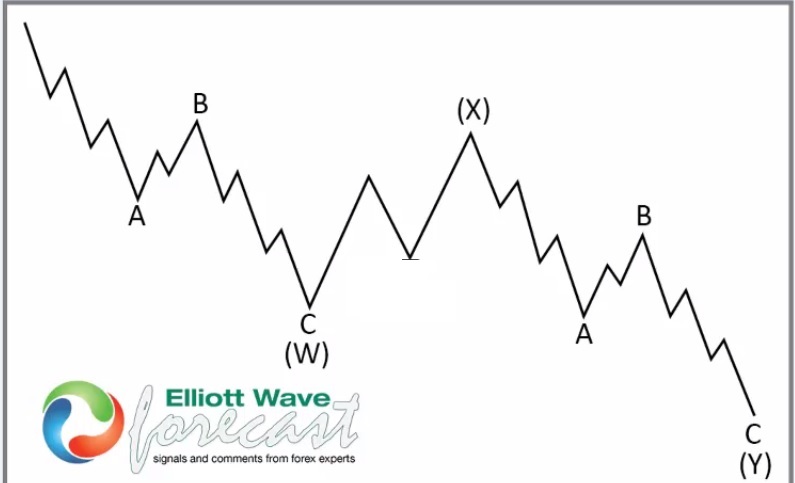
The structure is broken down into three distinct phases:
- Wave W: The first corrective pattern (often a standard A-B-C zigzag or flat).
- Wave X: A counter-trend connecting wave that temporarily tricks retail traders into thinking the primary trend has resumed.
- Wave Y: The final corrective pattern that completes the entire structure, usually terminating near key Fibonacci extensions.
Instead of a simple 3-wave move, a WXY structure is a 7-swing mechanism (3-3-3 sub-wave structure) that creates a prolonged horizontal or deep consolidation.
Why the WXY Structure Drives Profitability Ratios High
The profitability ratio of a trading system is mathematically determined by the size of your average wins relative to your average losses, multiplied by your win rate. The WXY structure directly optimizes both sides of this equation in three distinct ways:
- Eliminating “Wave 3” Deception (Risk Mitigation)
The single biggest drain on a trader’s profitability ratio is entering a pullback too early, only to realize they didn’t buy a minor correction, but rather caught a falling knife.
In a standard A-B-C zigzag, Wave A consists of 5 impulsive sub-waves. This makes it structurally identical to the start of a massive trend reversal (Wave 1). If you buy the end of Wave C, you run the risk that the market is actually embarking on a brutal Wave 3 extension against you.
The WXY Advantage: In a WXY structure, Wave W originates as a 3-wave corrective structure, not a 5-wave impulse. By identifying a 3-wave sub-structure early on, a quantitative system can scientifically confirm that the market is in a temporary correction rather than a structural trend reversal. This slashes the frequency of catastrophic losses.
- High-Confluence Asymmetric Risk/Reward Ratios
To drive profitability ratios high, you need tight stop-losses and expansive targets. The mathematical relationship between the waves in a WXY structure provides exact mathematical invalidation points using Fibonacci Confluence.
- Wave X typically retraces 50% to 85.4% of Wave W.
- Wave Y regularly targets the 100% to 123.6% Fibonacci extension of Wave W.
- The Hard Invalidation: Structurally, Wave Y cannot exceed the 161.8% extension of Wave W.
This gives traders a mathematically precise setup: buy or sell at the 100% extension level of Wave W, and place an incredibly tight stop-loss just past the 161.8% line. If the market breaches that level, the pattern is invalidated instantly. This tiny downside risk compared to riding the resumption of the macro-trend yields an incredibly high Risk-to-Reward ratio (often 1:4 or higher), exponentially boosting your net profitability metrics.
- Preserving Capital via Momentum Exhaustion
Trading during choppy, directionless markets is a quick way to suffer minor capital losses. The WXY structure acts as a filter. Because it is a complex structure, volume and momentum (measured via indicators like the RSI) steadily dry up across the lifespan of the pattern.
By waiting for Wave Y to exhaust its momentum, traders intentionally sit on their hands during low-probability conditions. They deploy capital only when the 7-swing structure is complete, ensuring high capital efficiency and a higher win velocity.
Strategic Summary for Traders
| Metric Impacted | The Traditional Trajectory | The WXY Structural Advantage |
| Win Rate | Lowered by entering fake trend-extensions early. | Higher; entries occur only after a confirmed 7-swing correction. |
| Average Loss Size | Large, due to ambiguous invalidation zones. | Structurally capped tightly at the 161.8% Fibonacci extension. |
| Profitability Ratio | Suppressed by overtrading choppy market noise. | Driven high by catching macro-trends at extreme exhaustion points. |
Real trade setups triggered after the WXY correction matures.
Below are a few trade setups that EWF has shared and executed with our members.
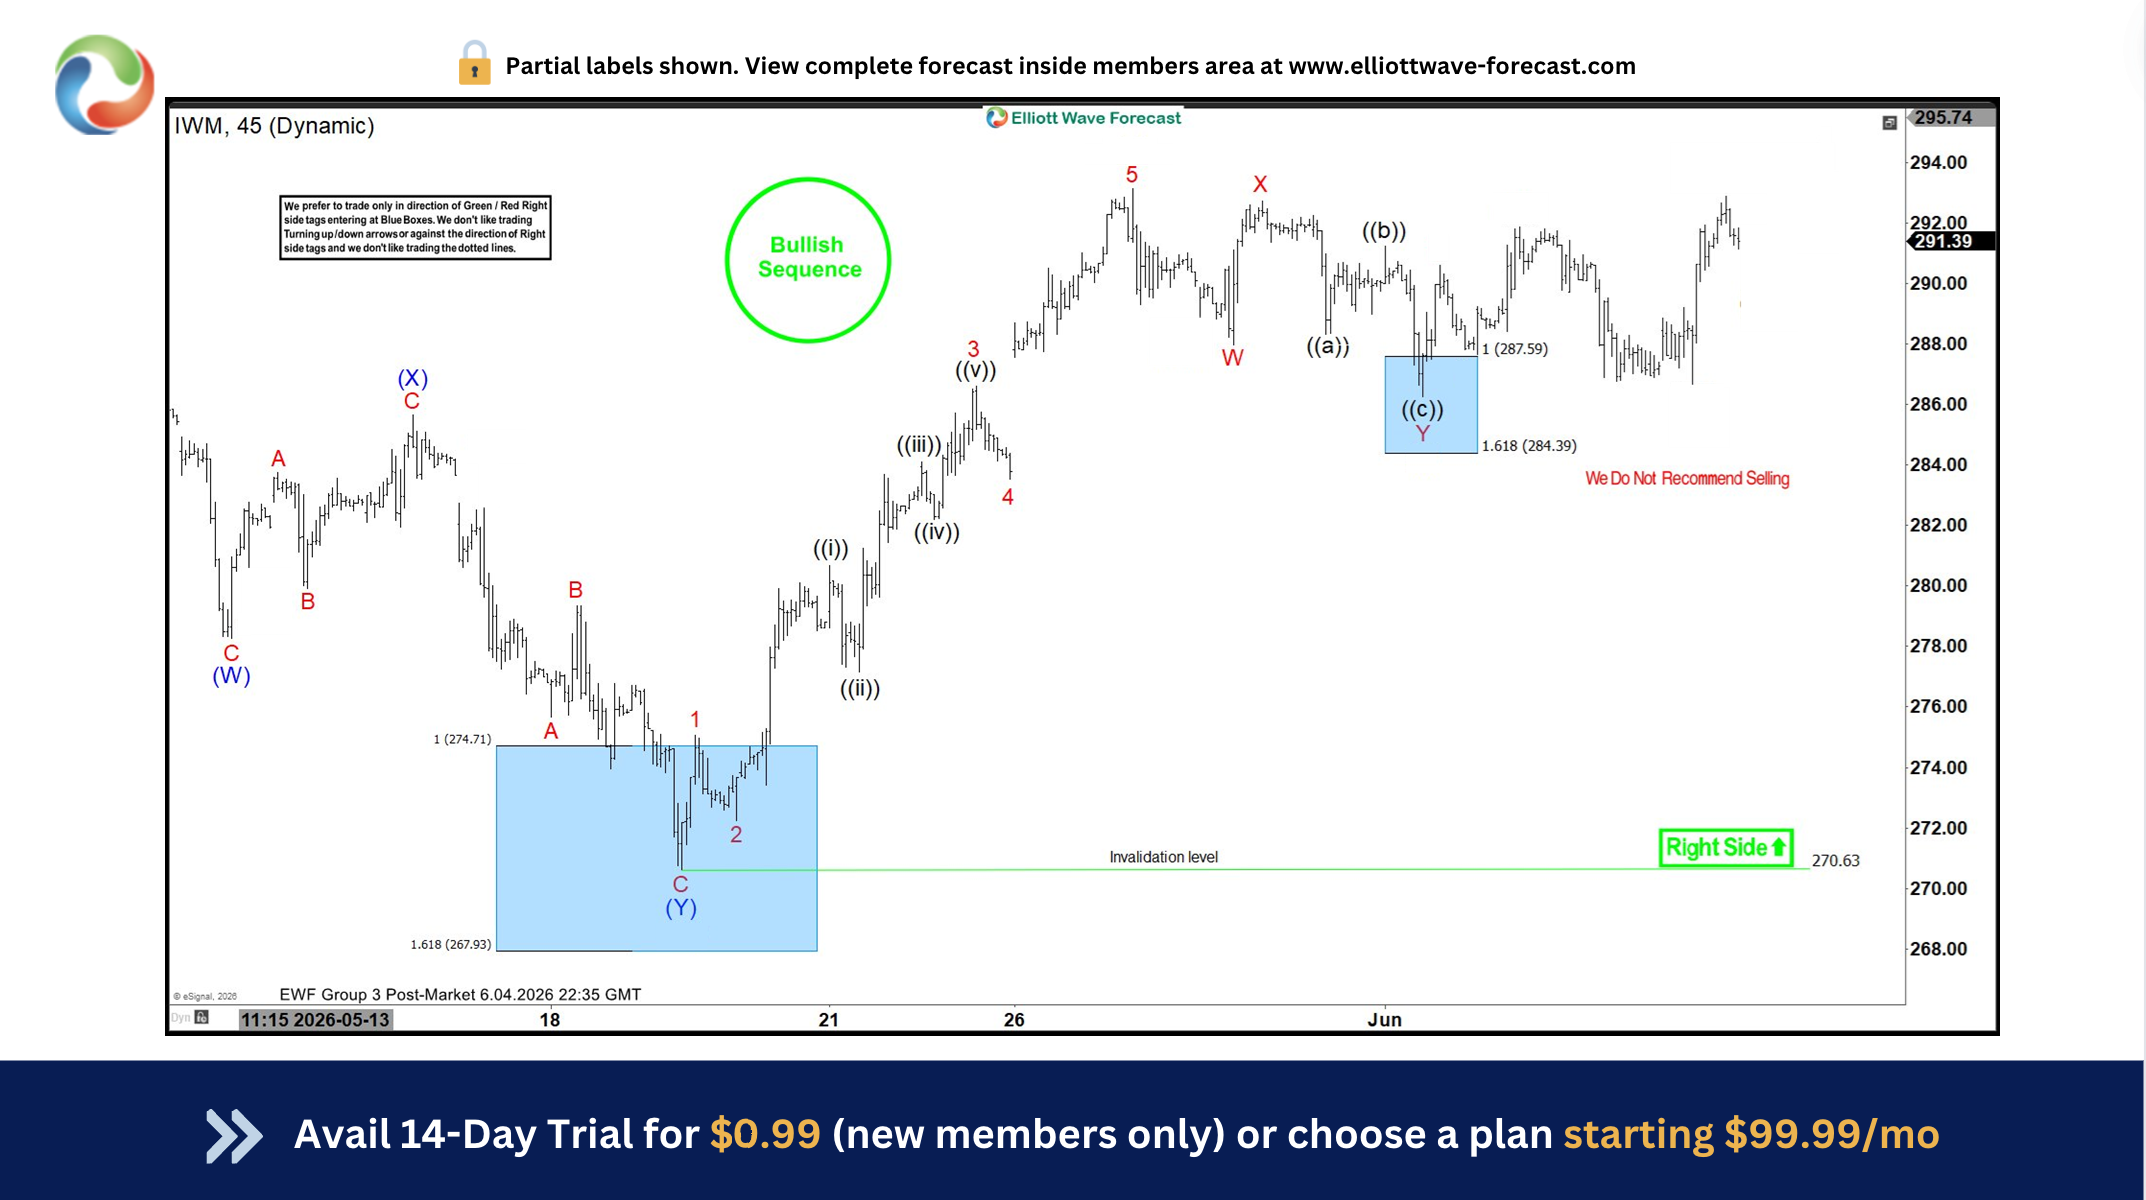
The $IWN chart below illustrates a trade setup where the market completed a WXY structure into a larger Blue Box, sparking a rally that finished an impulse. Immediately afterward, price moved sideways, forming another WXY into a smaller Blue Box, where buyers stepped in again — a more disciplined approach than simply buying at the end of an ABC.
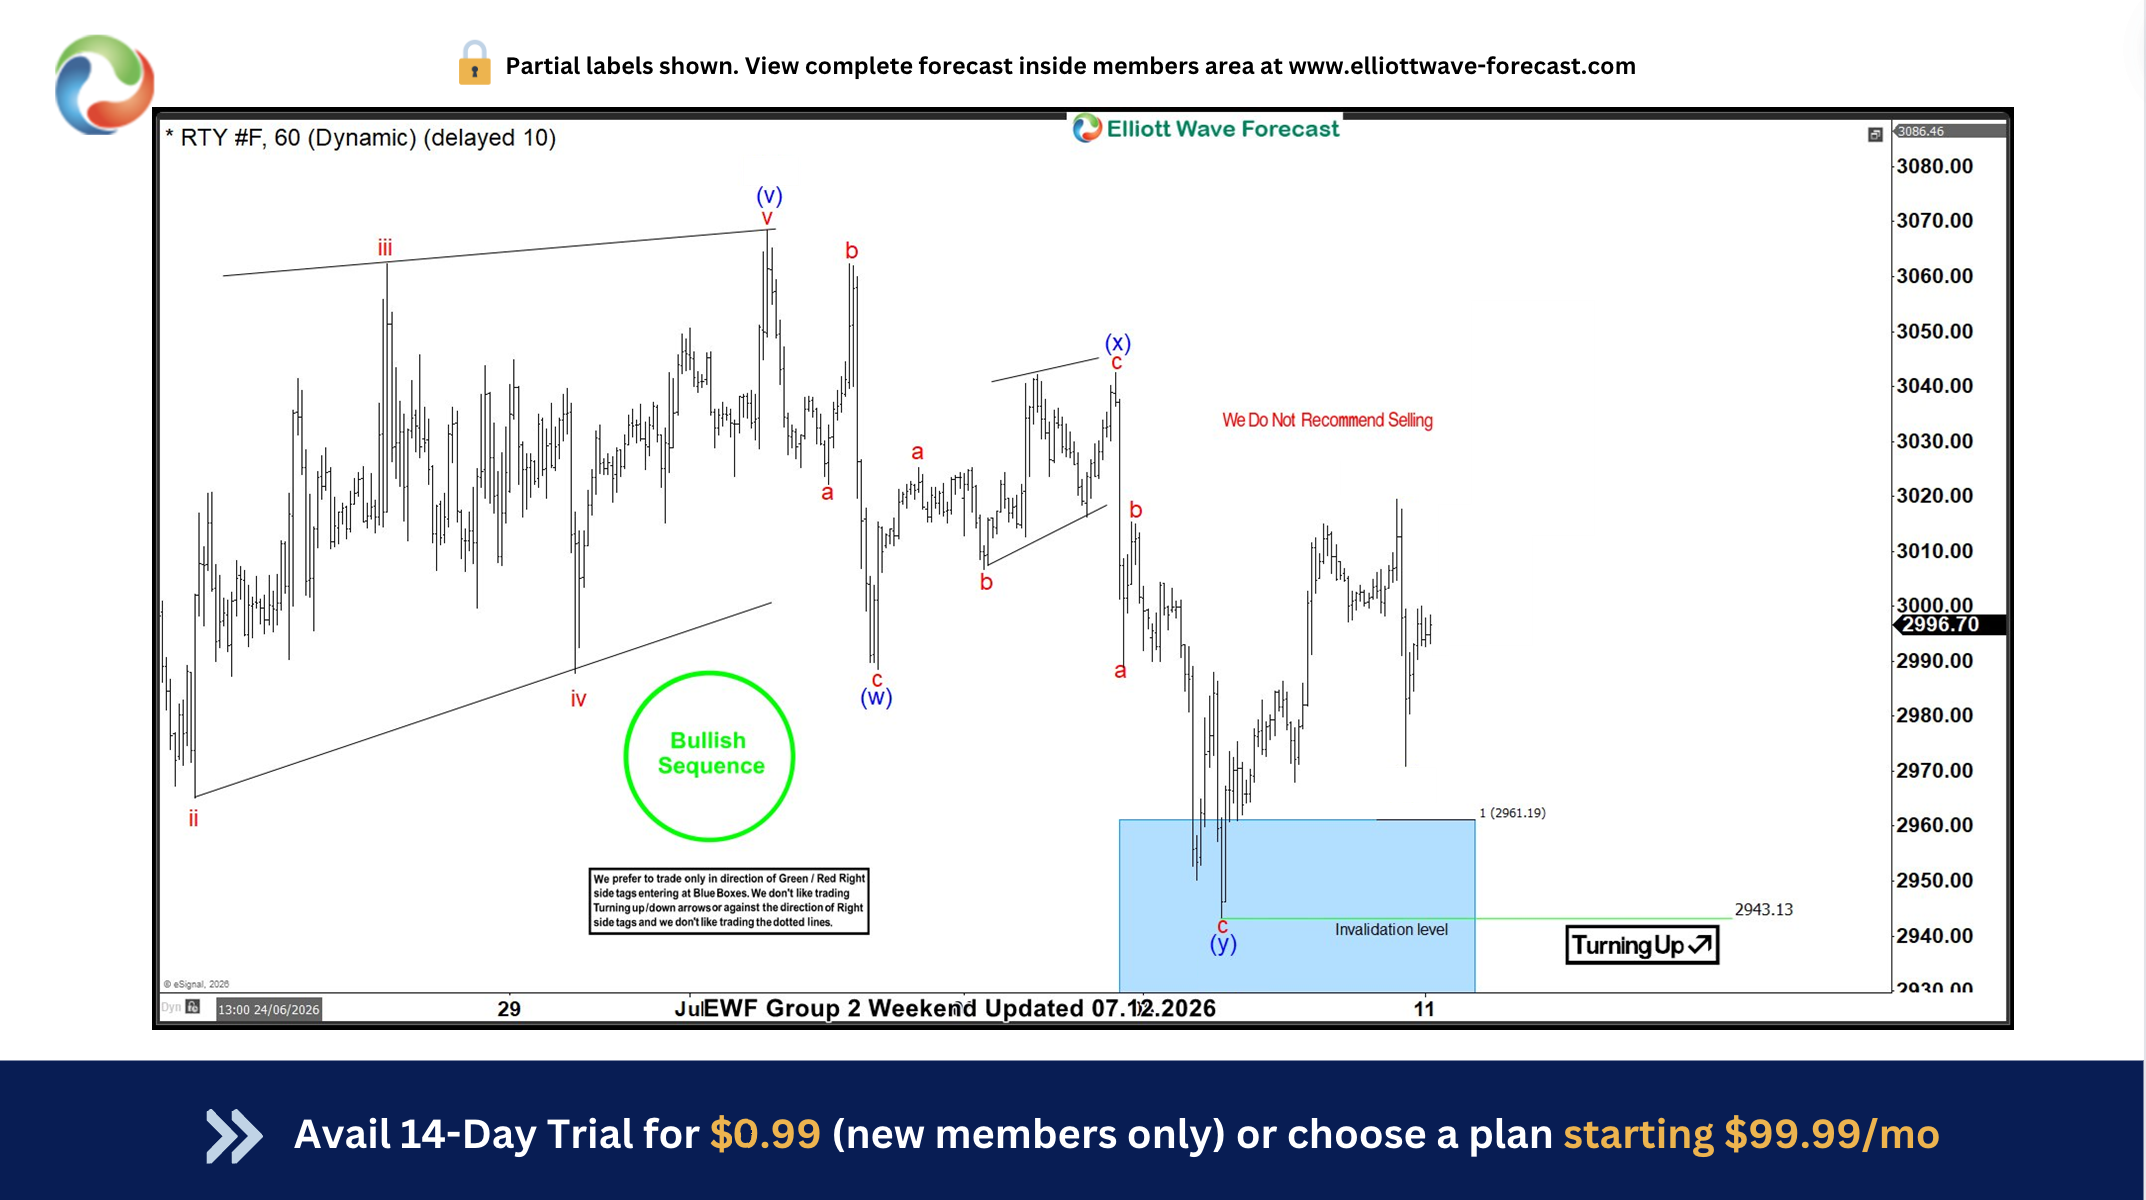
The $RTY charts below highlight the WXY corrective sequence and pinpoint a defined execution zone, specifically within the 2961.19 – 2910.71 range.
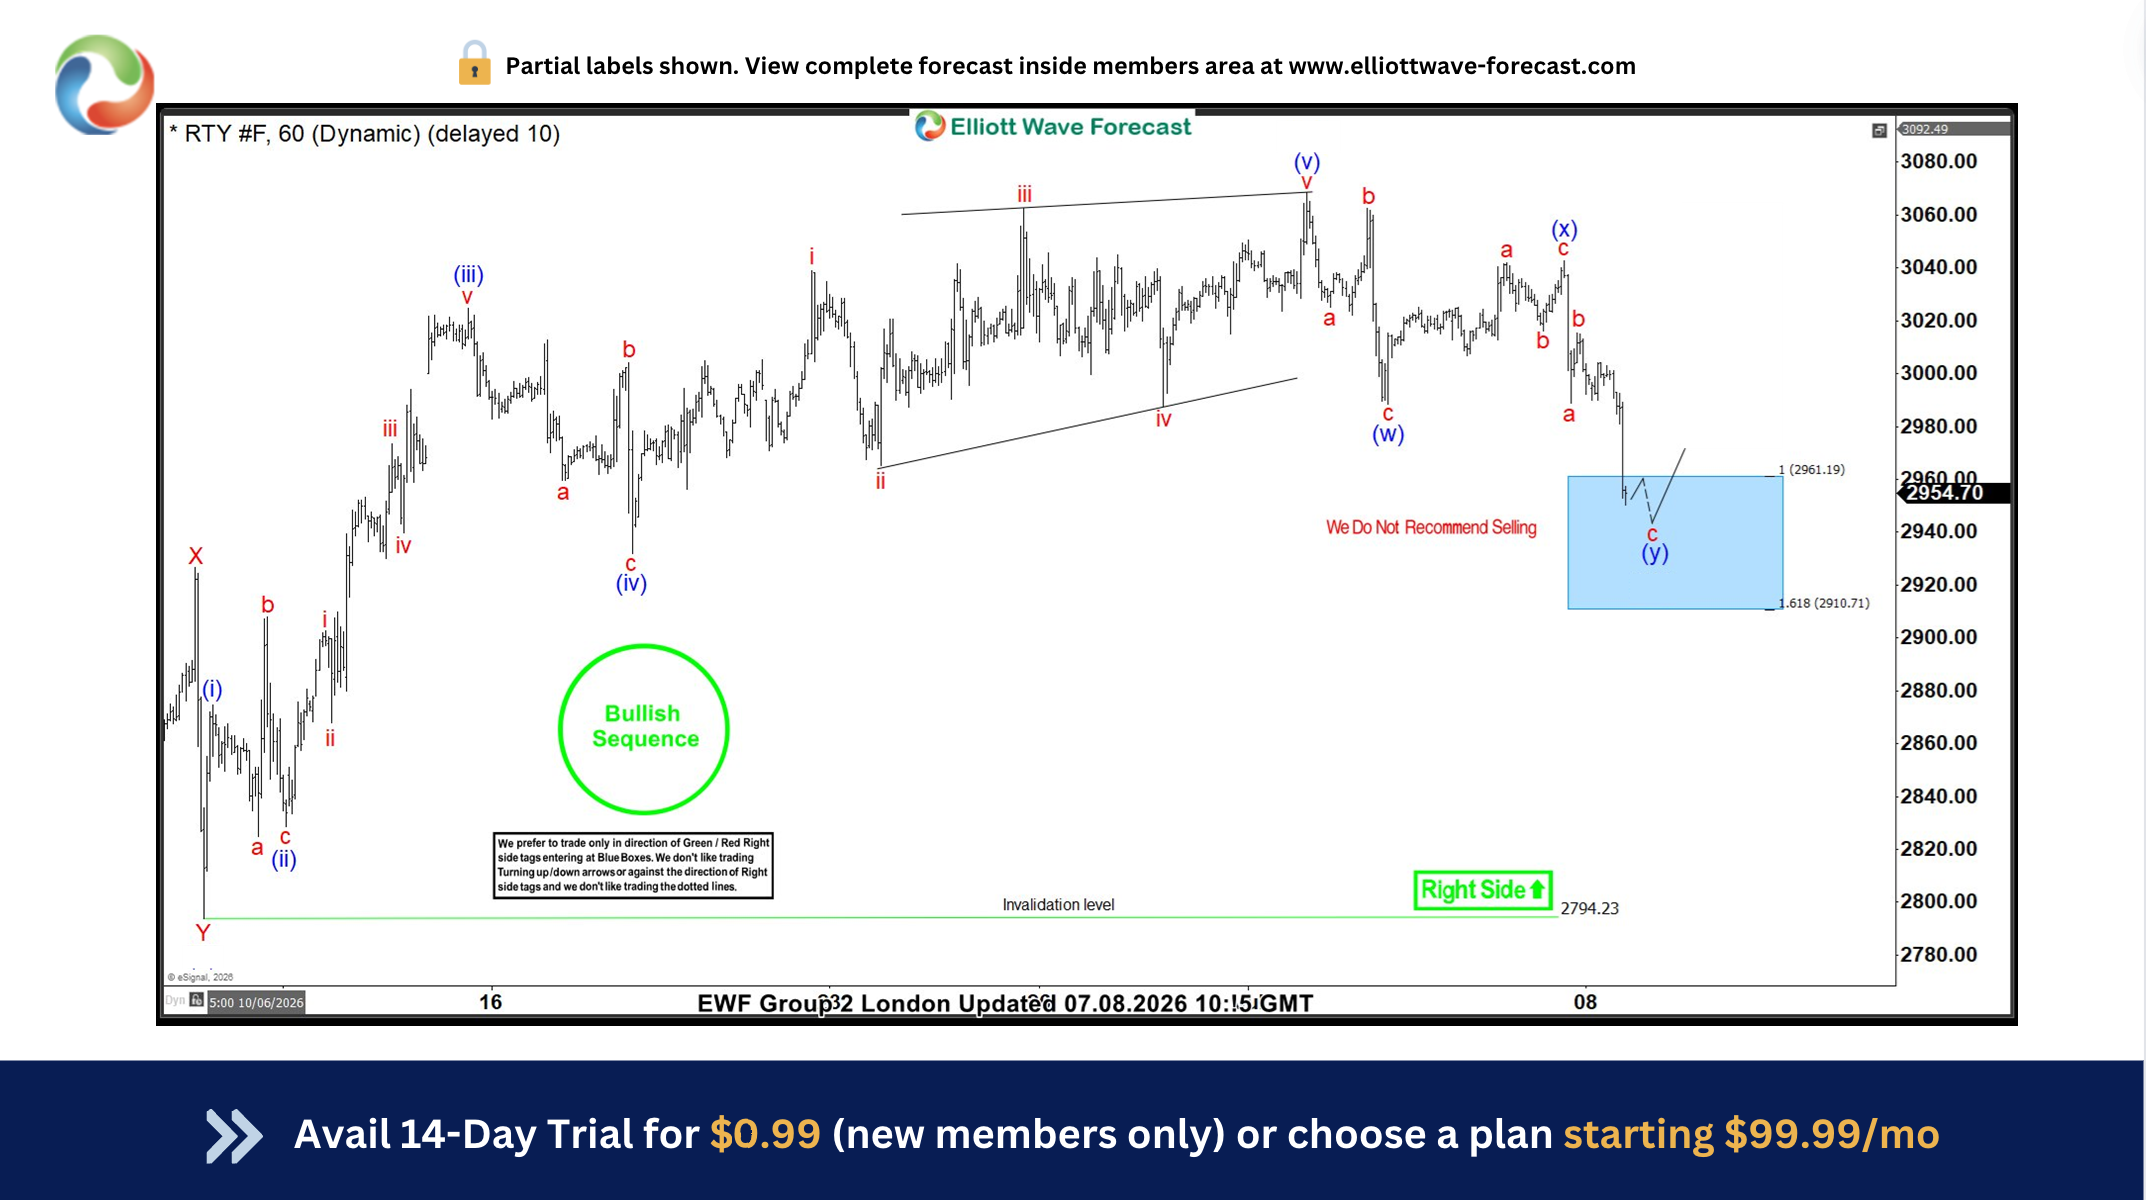
The below $RTY charts illustrate a sharp upward reaction immediately following the completion of the WXY corrective structure.
Conclusion
The WXY structure is the ultimate tool for turning market complexity into statistical profitability. By proving that a counter-move is purely corrective, providing exact mathematical boundaries for risk, and preventing premature entries, it protects capital when the market is uncertain and maximizes gains when the dominant trend resumes. To achieve an elite profitability ratio, stop trading simple pullbacks and start mastering the structural geometry of the Double Three.
To see how these concepts translate into real-world market geometry and practical trading setups, watch this comprehensive breakdown on How to trade a WXY Elliott Wave Structure, which offers detailed visual walk-throughs of the Fibonacci extension and retracement rules discussed above.
Why EWF ?
At Elliottwave Forecast (EWF), we deliver consistent market updates through regular charts update. Our analysts update 1‑hour charts four times daily and 4‑hour charts once per day across all 78 instruments. In addition, we host five live sessions each day and maintain a 24‑hour chatroom, providing clients with real‑time market guidance and answers to any questions they may have.
You can start a 14‑day trial with us today here and cancel anytime by emailing support@elliottwave-forecast.com


