Hello fellow traders. In this technical article we’re going to take a quick look at the Elliott Wave charts of Silver Commodity XAGUSD . As our members know, both Silver and Gold are showing incomplete bearish sequences in the daily cycles. Recently SILVER made short term recovery that unfolded as Wave Zig Zag Pattern. In the further text we are going to explain the Elliott Wave Pattern and the Forecast.
Before we take a look at the real market example, let’s explain Elliott Wave Zigzag pattern.
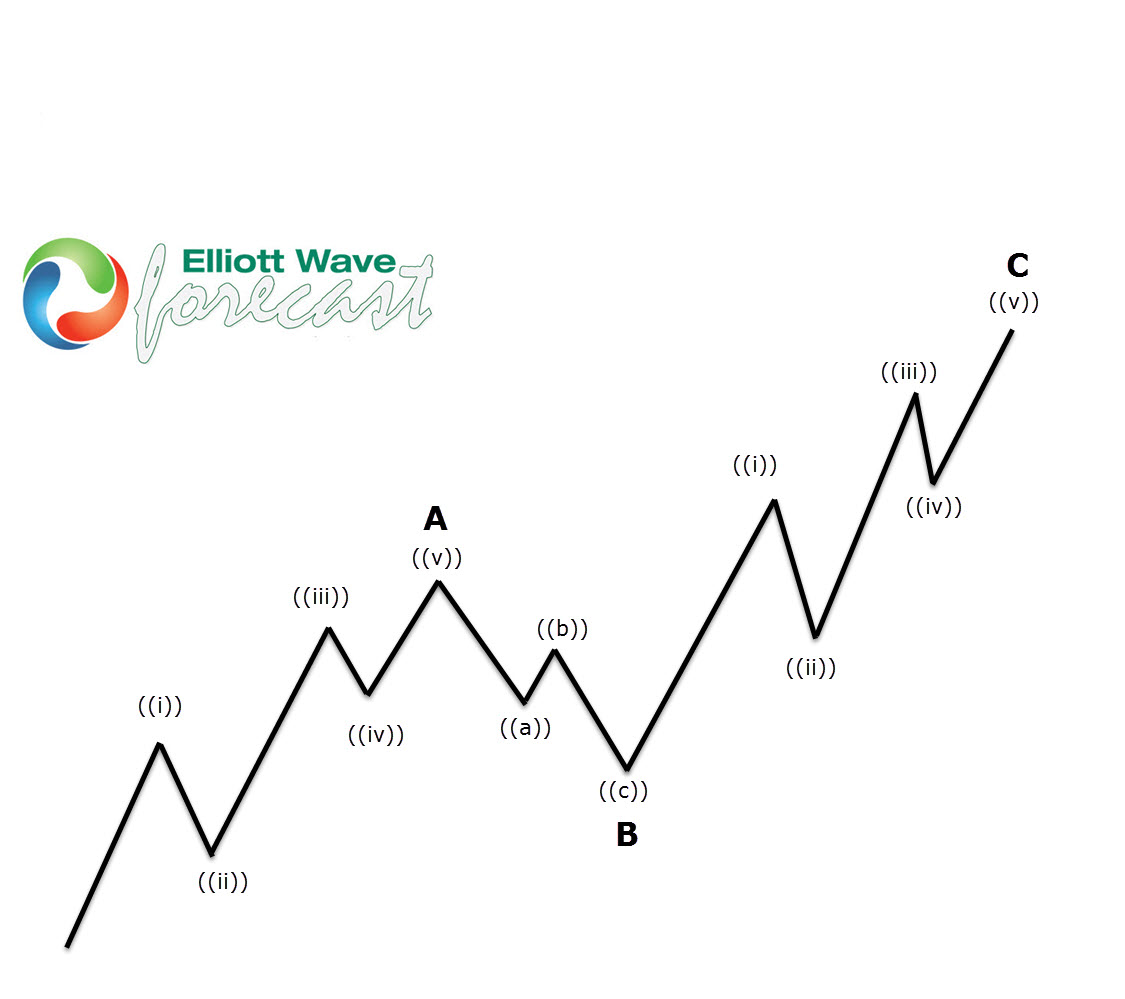
Elliott Wave Zigzag is the most popular corrective pattern in Elliott Wave theory . It’s made of 3 swings which have 5-3-5 inner structure. Inner swings are labeled as A,B,C where A =5 waves, B=3 waves and C=5 waves. That means A and C can be either impulsive waves or diagonals. (Leading Diagonal in case of wave A or Ending in case of wave C) . Waves A and C must meet all conditions of being 5 wave structure, such as: having RSI divergency between wave subdivisions, ideal Fibonacci extensions and ideal retracements.
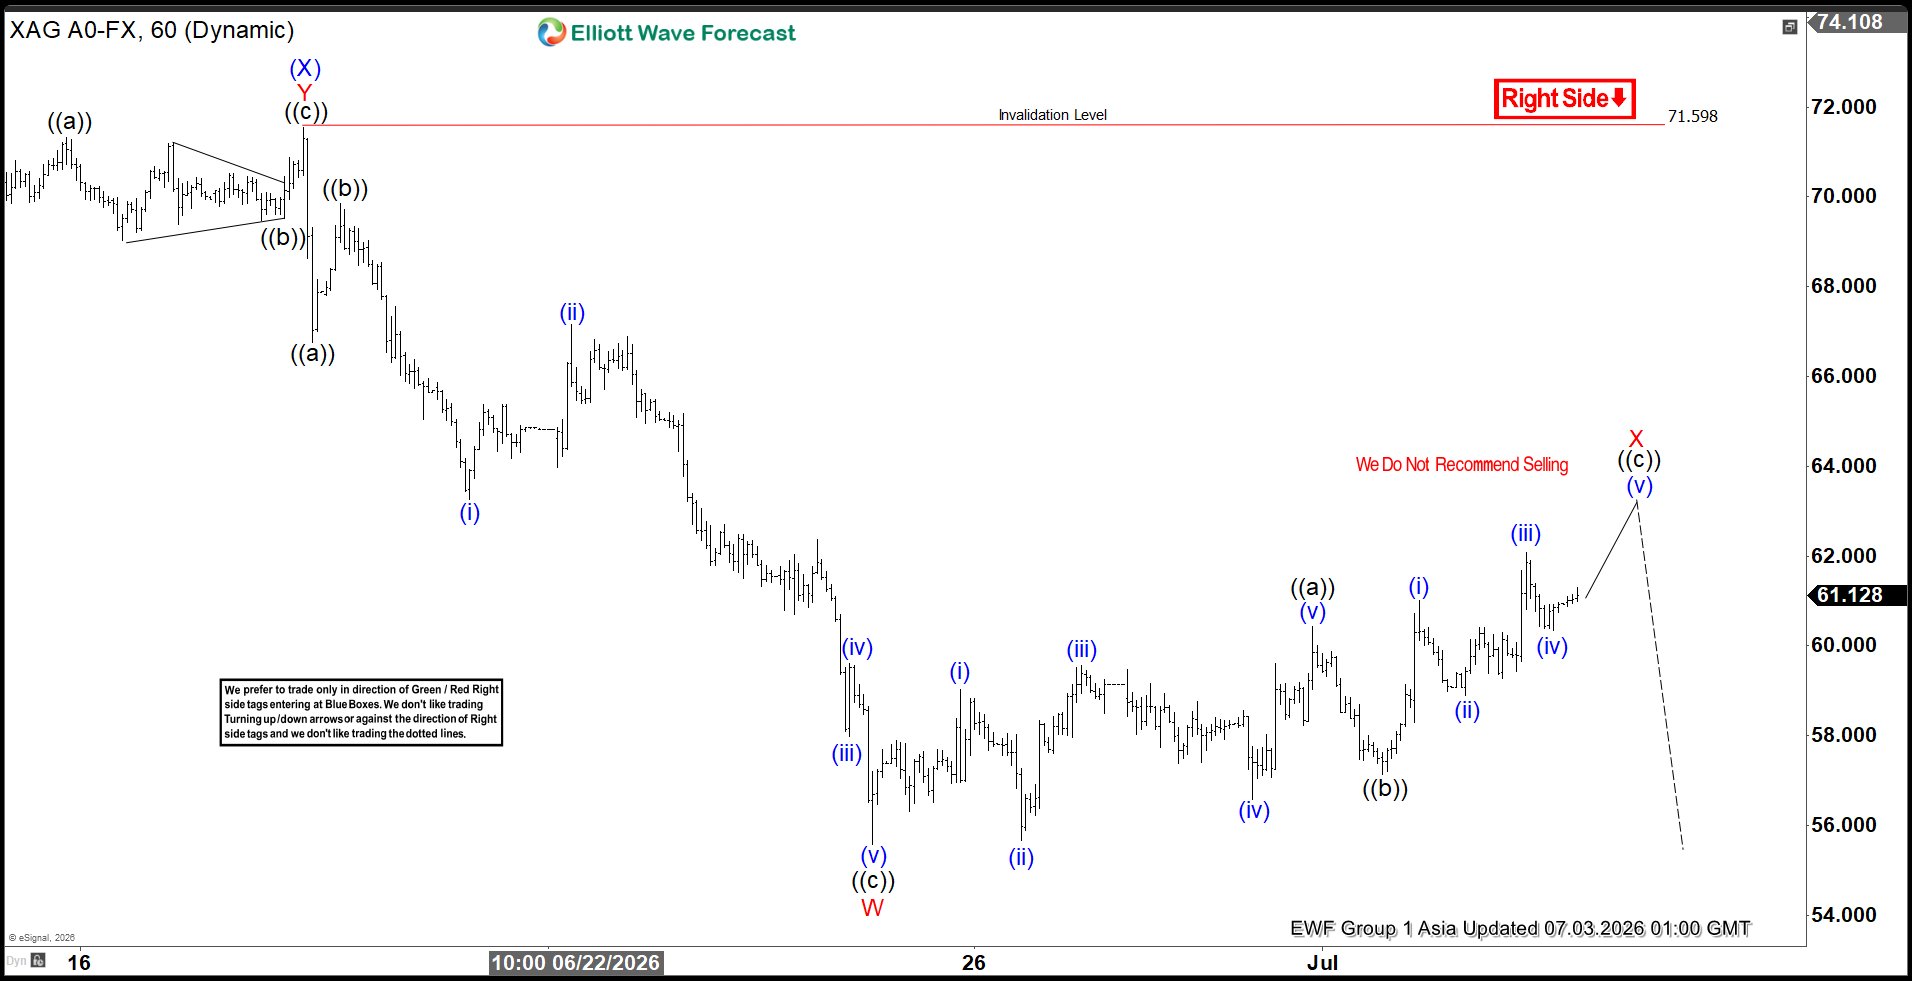
SILVER Elliott Wave 1 Hour Chart 07.03.2026
The current view suggests that SILVER is forming a recovery against the 71.598 peak. The price action is unfolding as an Elliott Wave Zig Zag pattern. We can count five waves within the first leg of the correction, labeled as ((a)).
The current structure suggests that another short-term high could still develop to complete the correction as a 5-3-5 pattern. The commodity can reach the 61.90–64.78 area, which represents a potential sellers’ zone, before the next leg lower begins. As usual, this zone was identified by measuring the equal legs of ((a)) against ((b)) using the Fibonacci extension tool. As long as the price remains below 64.78, the proposed bearish view remains valid.
Did you know ? 90% of traders fail because they don’t understand market patterns. Are you in the top 10%? Test yourself with this advanced Elliott Wave Test
Official trading strategy on How to trade 3, 7, or 11 swing and equal leg is explained in details in Educational Video, available for members viewing inside the membership area.
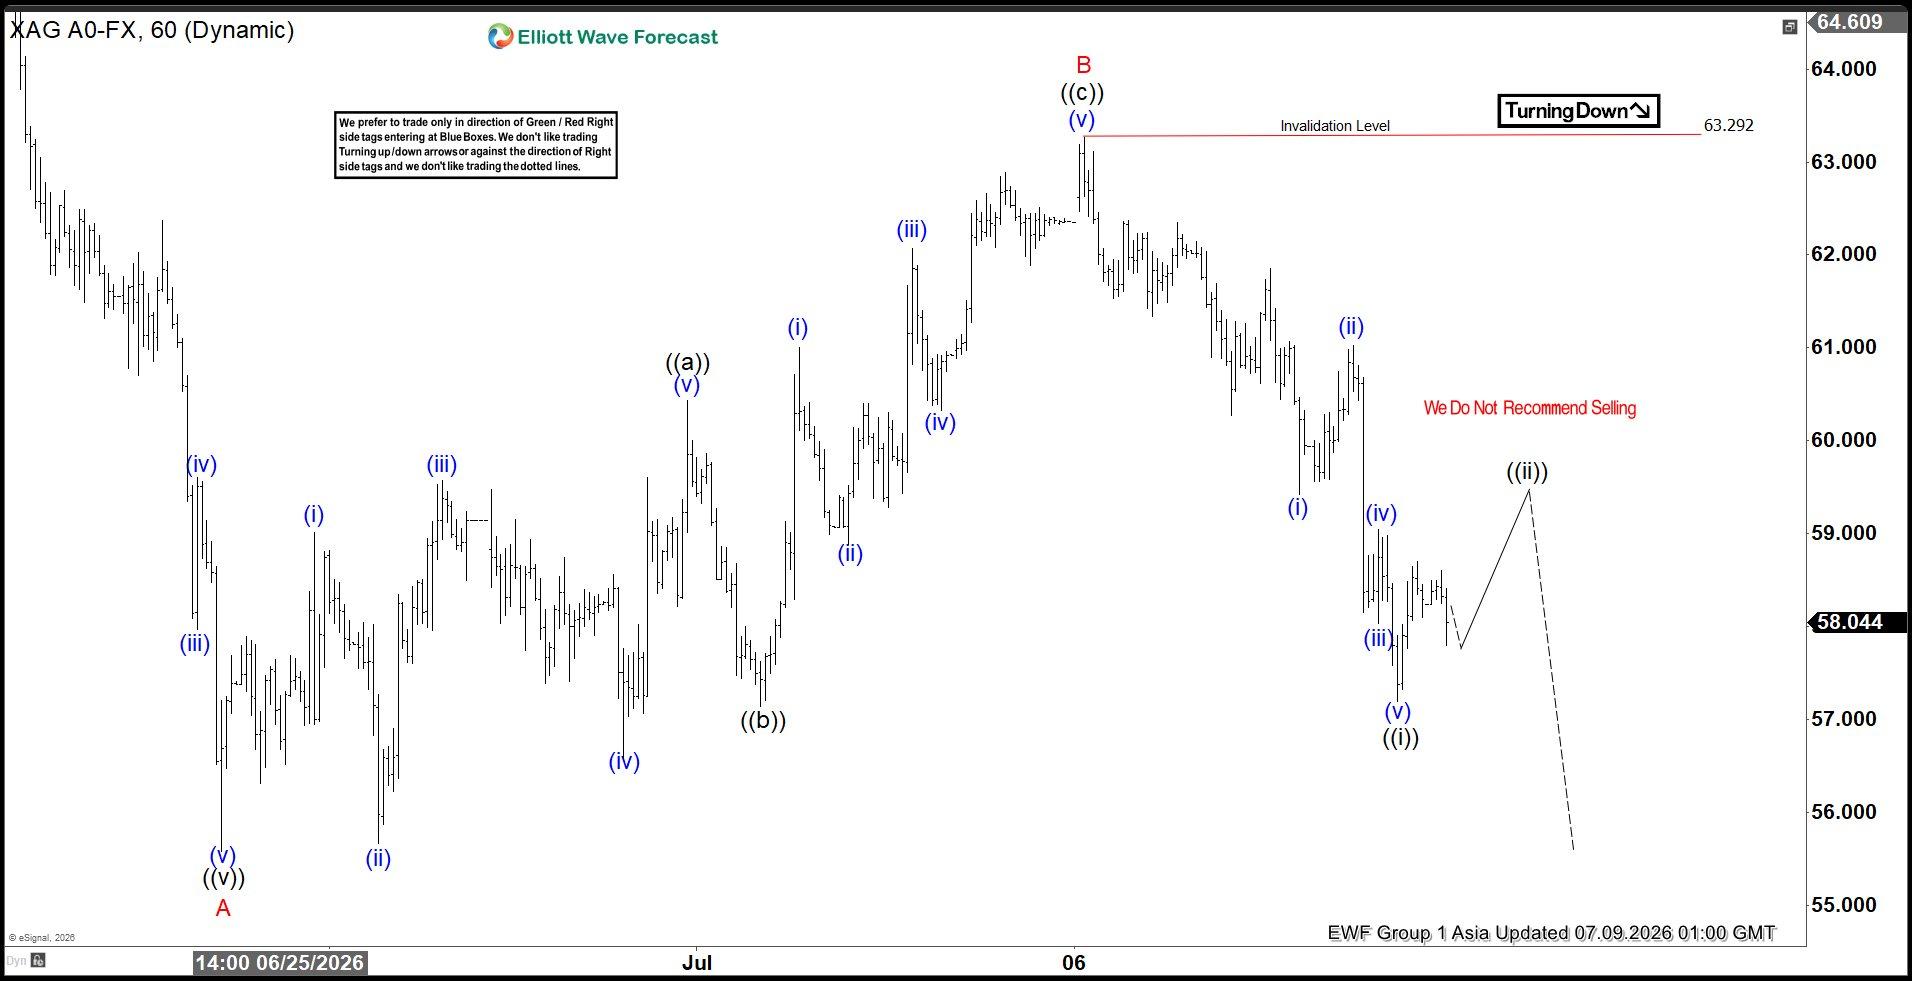
SILVER Elliott Wave 1 Hour Chart 07.09.2026
The commodity has made another leg higher and completed five waves within the ((c)) leg, as expected. The correction was completed within the proposed zone at 63.29, and we have seen a very decent reaction from this area. Now, we would like to see further downside extension and a break below the red A low to confirm the proposed bearish view.
Keep in mind that the market is dynamic, and the proposed view may have changed in the meantime. Our member chat rooms are open 24/7 and provide ongoing expert guidance on market trends and Elliott Wave analysis. Members are encouraged to ask questions about market structure and technical setups at any time
Join us today !
 Elevate your trading with Elliott Wave Forecast!
 Ask unlimited questions during trading hours (Monday to Friday). Our Chat Rooms are an excellent place to learn, with continuous support from our market experts!
 Explore our expert insights and real-time analysis covering Forex, Indices, Commodities, Cryptocurrencies, Stocks, and ETFs across 78 instruments.
 Gain exclusive access to our Official Trading Recommendations in the Live Trading Room, where seasoned experts provide valuable insights and guidance on new trading opportunities.
 For just $0.99, unlock a wealth of knowledge and experience with our 14-day Trial. Experience firsthand our proven trading strategy, which accurately defines Entry, Stop Loss, and Take Profit levels, empowering you to make informed decisions with confidence.
 Ready to take the next step? Get your 14-day Trial in just a few clicks!