The Global X Uranium ETF (URA) provides broad access to companies involved in uranium mining and the production of nuclear components. It serves as a strategic instrument for investors seeking exposure to the accelerating nuclear energy transition. Beyond its role as a sector proxy, URA reflects the growing importance of uranium in global energy policy, where decarbonization and energy security are driving renewed demand for nuclear power.
In this discussion, we turn to Elliott Wave analysis to evaluate the ETF’s long‑term technical structure. By examining its larger degree cycles and internal subdivisions, we aim to highlight the potential trajectory of uranium equities within the broader commodity supercycle. This perspective not only frames the ETF’s historical context but also identifies key inflection zones where investors may anticipate renewed momentum.
URA Elliott Wave Chart Monthly Chart
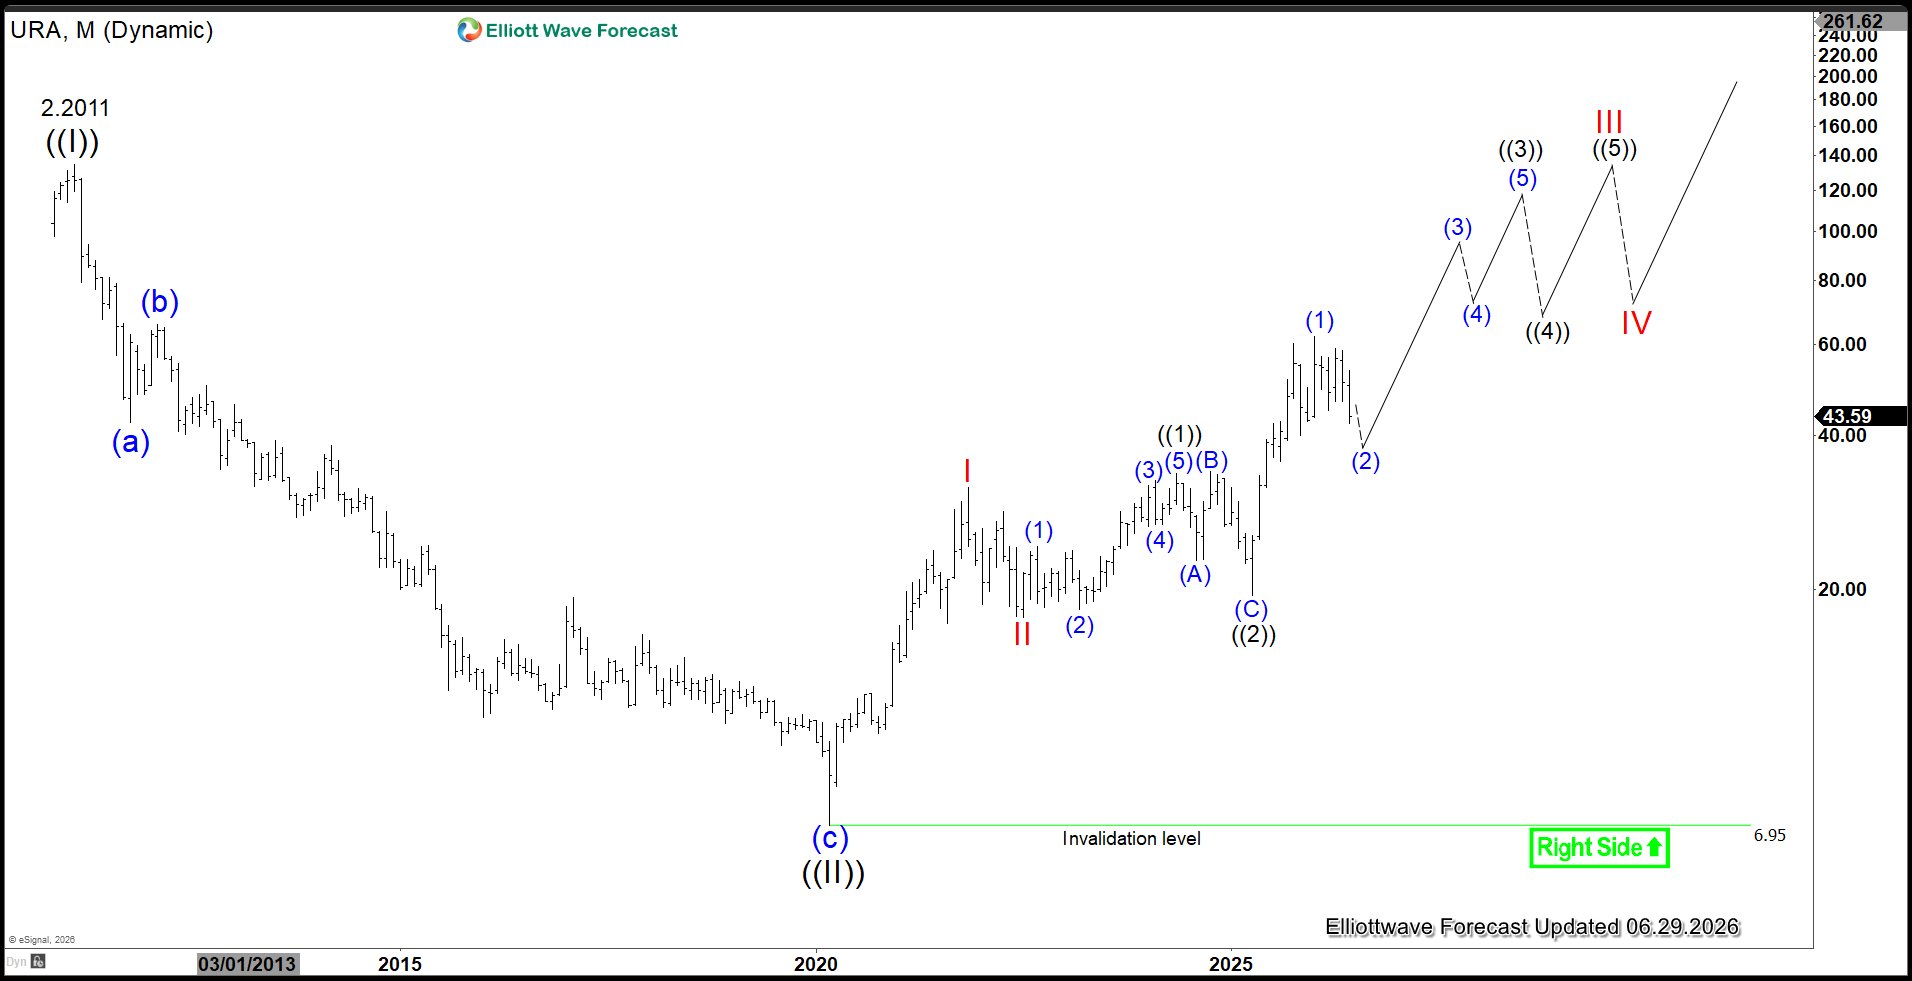
The monthly Elliott Wave chart of the Uranium Miners ETF (URA) shows that Grand Super Cycle wave ((II)) concluded at $6.95, establishing a long‑term base. From this low, the ETF initiated a new bullish cycle within wave ((III)), unfolding as a five‑wave impulse.
Advancing from wave ((II)), wave I terminated at $31.60. A corrective decline in wave II followed which bottomed at $17.65. The ETF then resumed higher within wave III. The internal subdivision is also an impulse: wave ((1)) ended at $33.66, while wave ((2)) completed at $19.50. From there, URA nested higher within wave ((3)), with wave (1) of ((3)) reaching $62.28.
As long as price remains above $6.95, corrective pullbacks are expected to attract buyers in 3 or 7 swing sequences. It sets the stage for further upside in alignment with the larger bullish cycle.
URA Daily Elliott Wave Chart
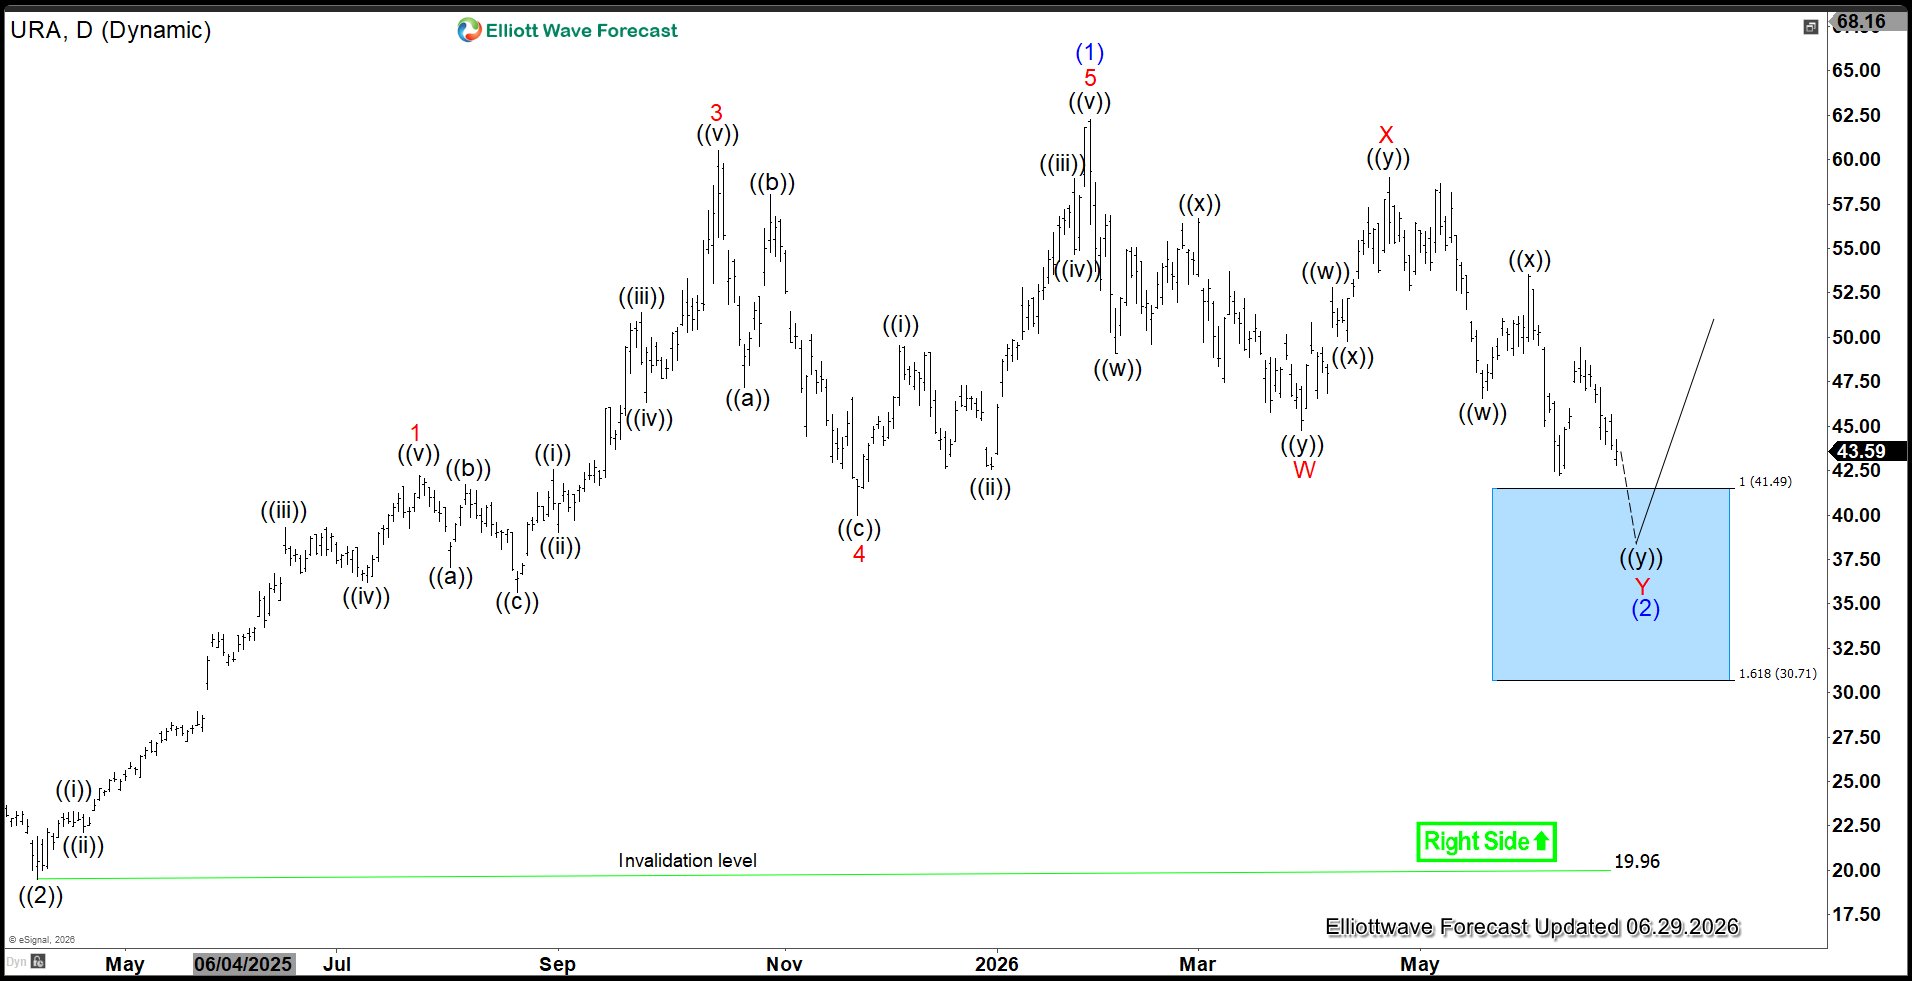
The daily chart of the Uranium ETF indicates that the rally from the wave ((2)) low on April 7, 2025 culminated in wave (1) at $62.28, forming a five‑wave diagonal. The subsequent pullback in wave (2) is unfolding as a seven‑swing corrective structure, commonly identified as a double three.
From the peak of wave (1), wave W concluded at $44.76. A rebound in wave X followed which reached $59.97. Wave Y is now in progress to complete wave (2). It has a 100%–161.8% Fibonacci extension target zone of $30.71 – $41.49 (the blue box area). This region should attract buyers, providing the foundation for renewed upside.
Stay ahead in forex, equities, and crypto with timely insights. Access consistent updates, forward‑looking analysis, and actionable trade setups through our 14‑day trial


