

Hello fellow traders. In this technical article, we are going to present Elliott Wave charts trading setup of Amazon (AMZN) Stock . The stock has recently completed a clean 3-wave pullback. Price action developed exactly as anticipated, but our entry was missed by less than $1. More precisely, the correction ended just $0.39 above our entry zone, highlighting the precision of the setup. In the following sections, we will break down the Elliott Wave structure in detail, explain the setup, and outline the target levels.
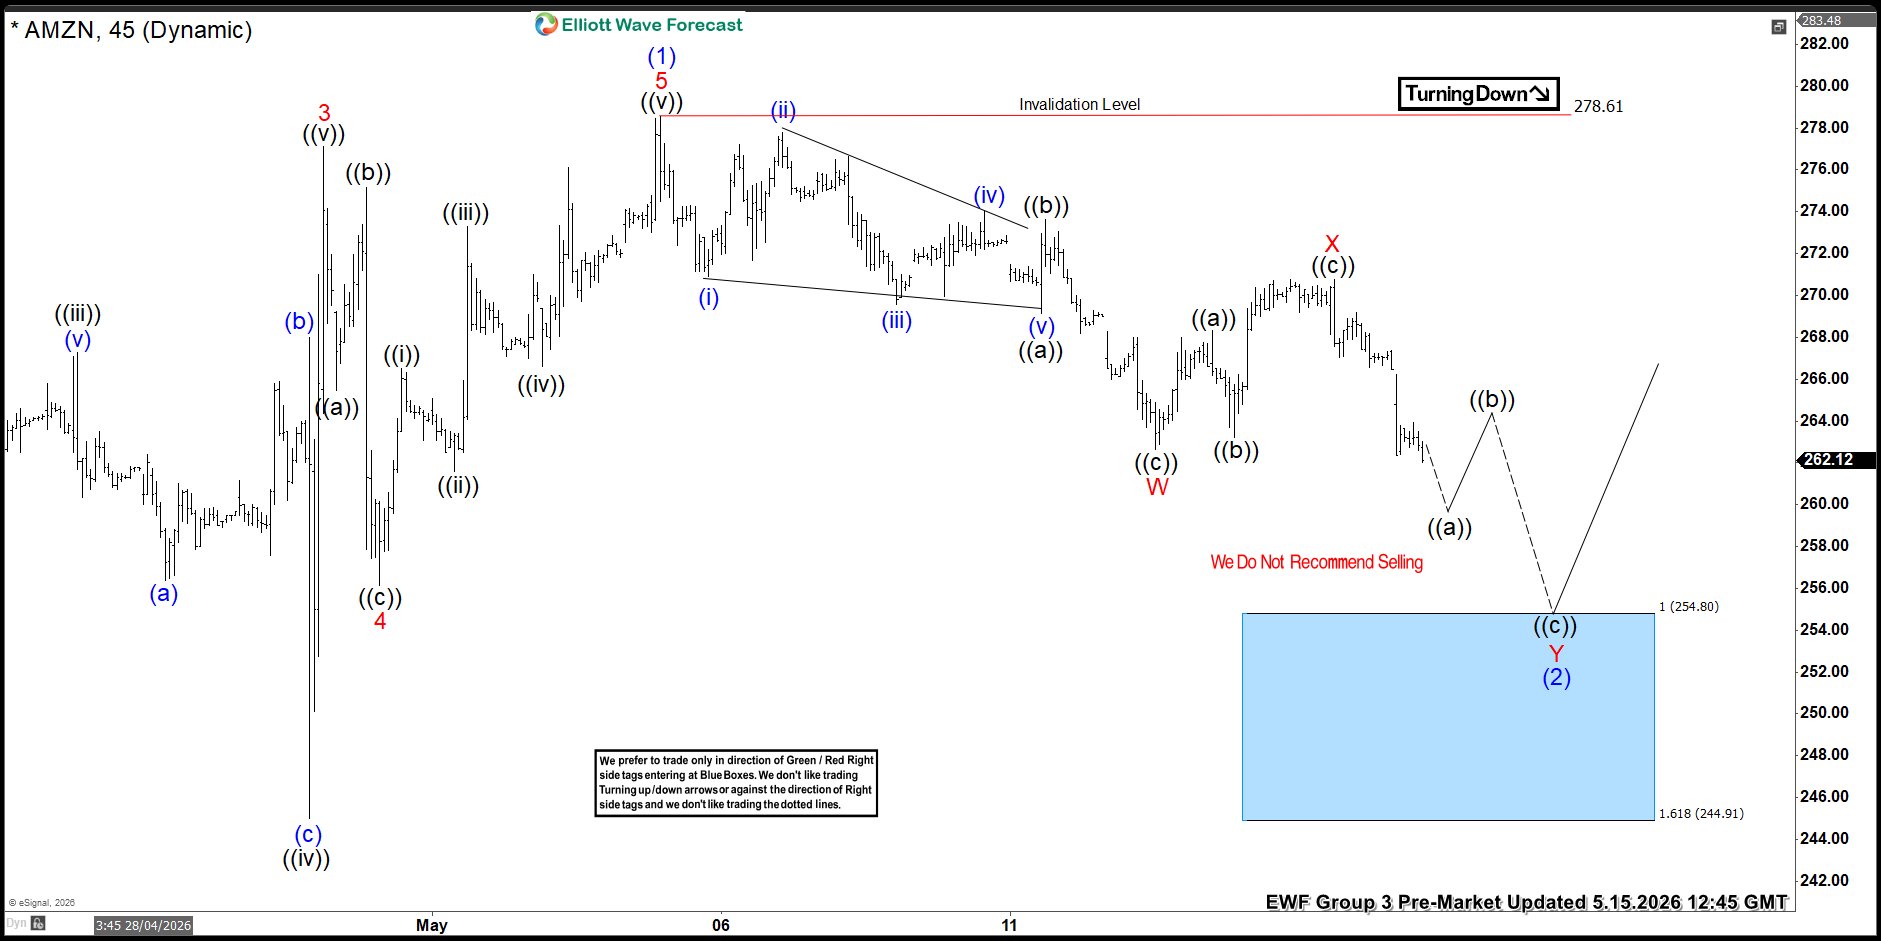
AMZN Elliott Wave 1 Hour Chart 05.15.2026
AMZN stock is currently developing a wave (2) pullback. From the 278.61 high, price action shows a clear sequence of incomplete swings, indicating that the correction remains in progress. We expect 3 waves bounce in ((b)) and another leg lower to complete the 7 swings structure.
The Blue Box buying zone stands at 254.8–244.9. We recommend that members avoid selling, as the broader trend remains firmly bullish. From this area, we anticipate at least a 3-wave bounce.
Once price reaches the 50% Fibonacci retracement against the red X connector, positions will be made risk-free by moving the stop-loss to breakeven while securing partial profits. The stop-loss is placed just below the 1.618 Fibonacci extension at 244.91.
90% of traders fail because they don’t understand market patterns. Are you in the top 10%? Test yourself with this advanced Elliott Wave Test
Official trading strategy on How to trade 3, 7, or 11 swing and equal leg is explained in details in Educational Video, available for members viewing inside the membership area.
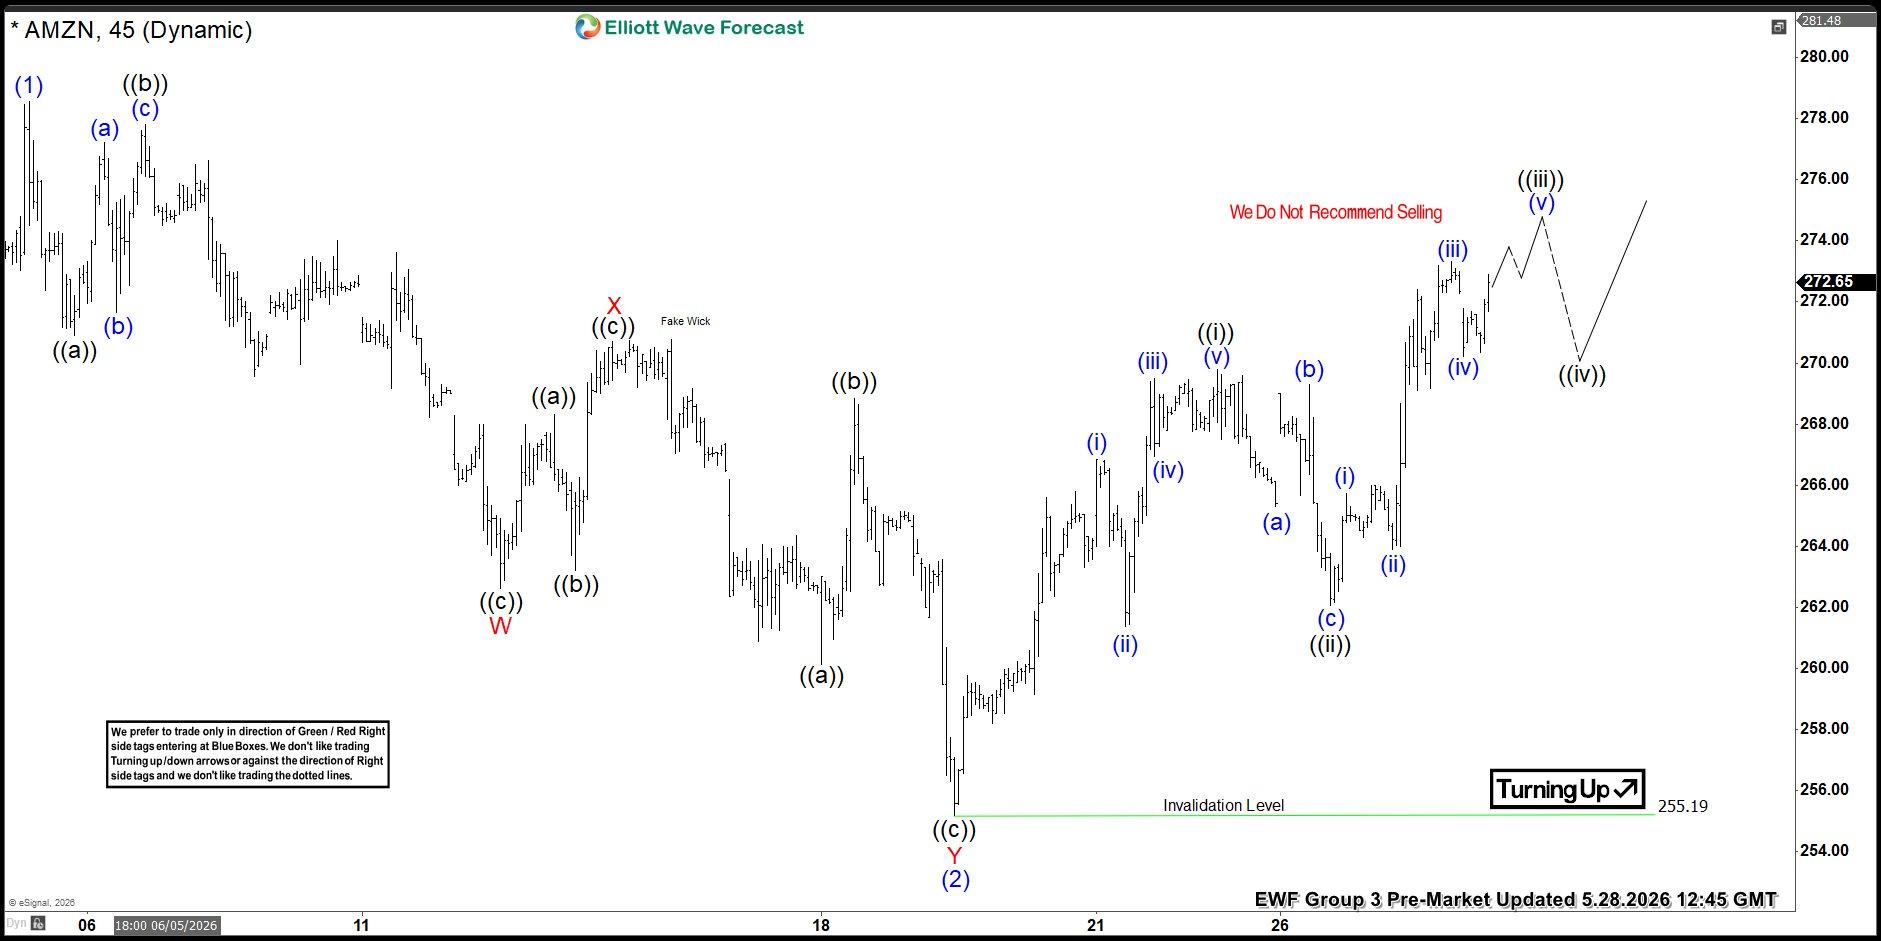
AMZN Elliott Wave 1 Hour Chart 05.28.2026
The stock delivered a bounce before extending lower into our anticipated Buying Zone. AMZN completed a clear 7-swing sequence, bottoming just $0.39 above our entry level. As a result, this setup did not trigger an entry. While we missed this particular trade, it is important to emphasize that missed opportunities are a normal part of the trading process. Not every setup will provide a perfect execution, even when the analysis is accurate.
At the same time, we continue to hold several well-positioned trades across other instruments, as shared with our members in the Live Trading Room. Our focus remains on consistently identifying high-probability setups rather than chasing every move.
We will continue to monitor AMZN closely and look for the next trading opportunity as the structure evolves.
Reminder for members: Our chat rooms in the membership area are available 24 hours a day, providing expert insights on market trends and Elliott Wave analysis. Don’t hesitate to reach out with any questions about the market, Elliott Wave patterns, or technical analysis. We’re here to help.

Join us today !
 Elevate your trading with Elliott Wave Forecast!
 Ask unlimited questions during trading hours (Monday to Friday). Our Chat Rooms are an excellent place to learn, with continuous support from our market experts!
 Explore our expert insights and real-time analysis covering Forex, Indices, Commodities, Cryptocurrencies, Stocks, and ETFs across 78 instruments.
 Gain exclusive access to our Official Trading Recommendations in the Live Trading Room, where seasoned experts provide valuable insights and guidance on new trading opportunities.
 For just $0.99, unlock a wealth of knowledge and experience with our 14-day Trial. Experience firsthand our proven trading strategy, which accurately defines Entry, Stop Loss, and Take Profit levels, empowering you to make informed decisions with confidence.
 Ready to take the next step? Get your 14-day Trial in just a few clicks!
Ready to take the next step? Get your 14-day Trial in just a few clicks!


