

JPMorgan’s stock (JPM) may face mixed conditions during June as markets digest recent economic data and shifting rate expectations. Investors will likely watch credit trends closely because tighter financial conditions can pressure loan growth. However, JPM’s strong balance sheet often helps it navigate uncertain periods, and its diversified revenue streams can soften short‑term volatility. As June progresses, sentiment may hinge on updated guidance from bank leadership and broader market risk appetite.
During July and August, JPM could experience steadier momentum if economic indicators show resilience. Seasonal trading patterns often support financial stocks when liquidity improves and corporate activity rises. Moreover, JPM’s investment banking pipeline may strengthen if deal flow continues to recover. Even so, markets may react quickly to inflation updates and Federal Reserve signals, which can influence expectations for bank profitability. Therefore, investors may see a blend of stability and tactical swings through late summer.
Elliott Wave Outlook: JPM Weekly Charts January 2026

Last time we updated JPM in January, we noted that bullish momentum had carried into the new year while price action stayed choppy and uncertain. That behavior suggested the stock was entering a consolidation range that could break either through a correction or a strong bullish continuation. We also highlighted how each new high showed weaker follow‑through, which increased the probability of a corrective move and supported the idea of an emerging ending diagonal.
The range persisted because buyers still lack the strength to break it decisively. Only a powerful upside impulse would invalidate this scenario; otherwise, JPM continues to drift sideways while working through its wave (2) correction.
(If you want to learn more about Elliott Wave Principle, please follow these links: and .)
Elliott Wave Principle Behind the Market Structure
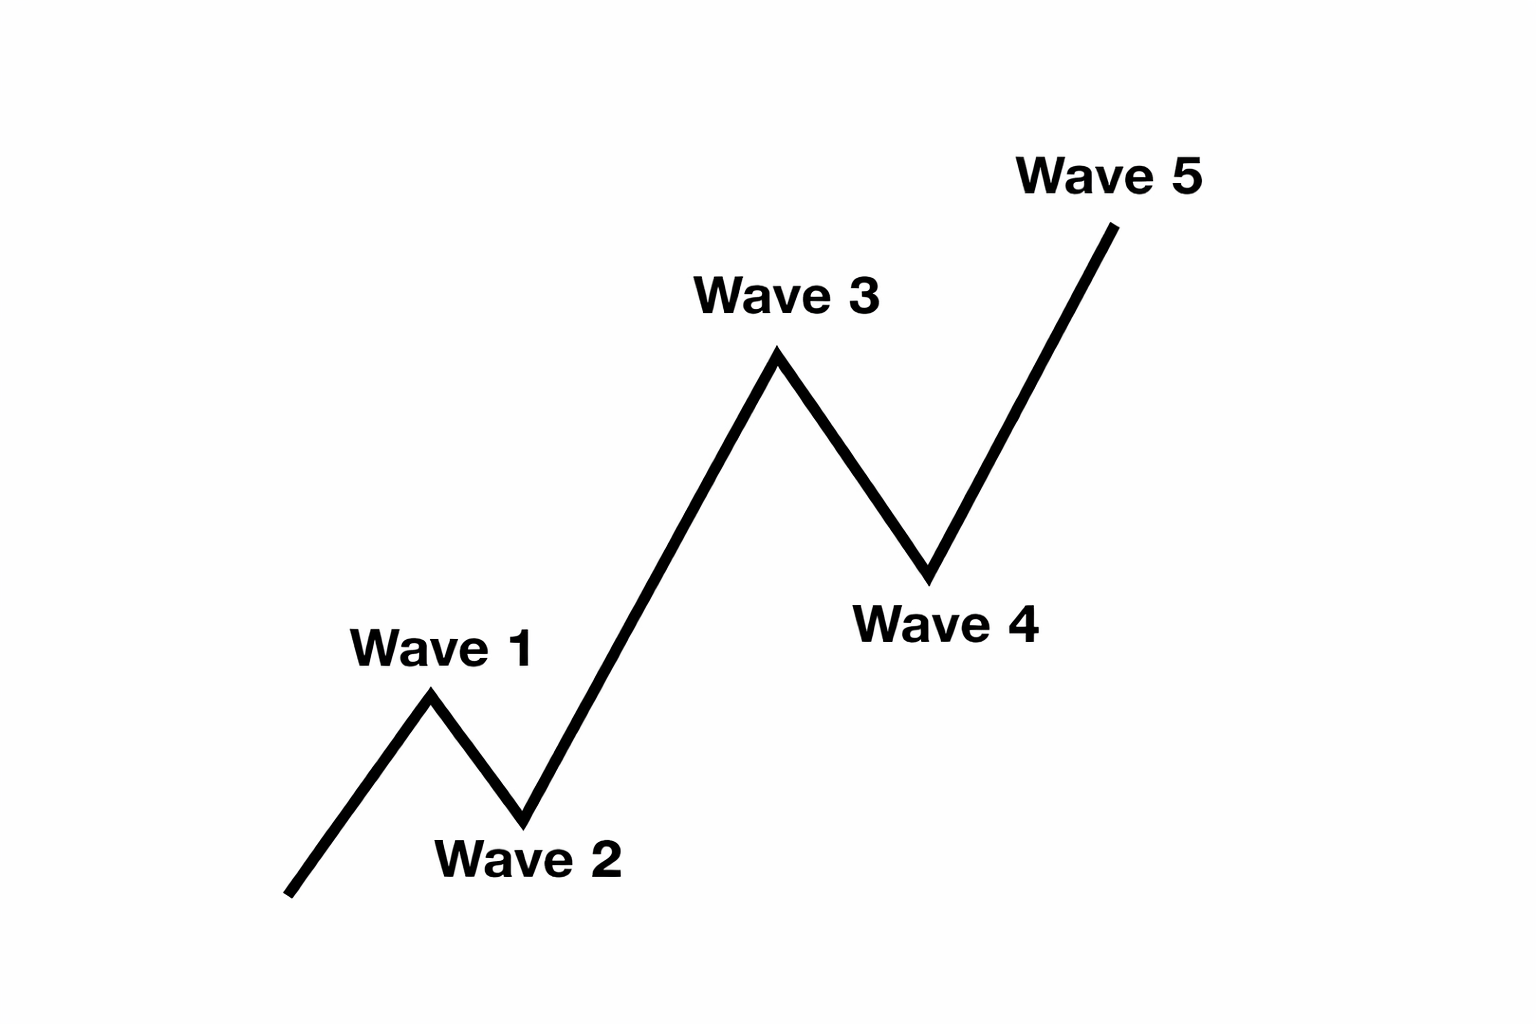
Impulse
An impulse is a clean 5‑wave pattern that drives the trend forward.
- Waves 1‑3‑5 are strong and directional.
- No overlap between waves 1 and 4.
- Wave 3 is usually the strongest.
- Structure is clear, with increasing momentum.
Elliott Wave Outlook: JPM Weekly Charts May 2026
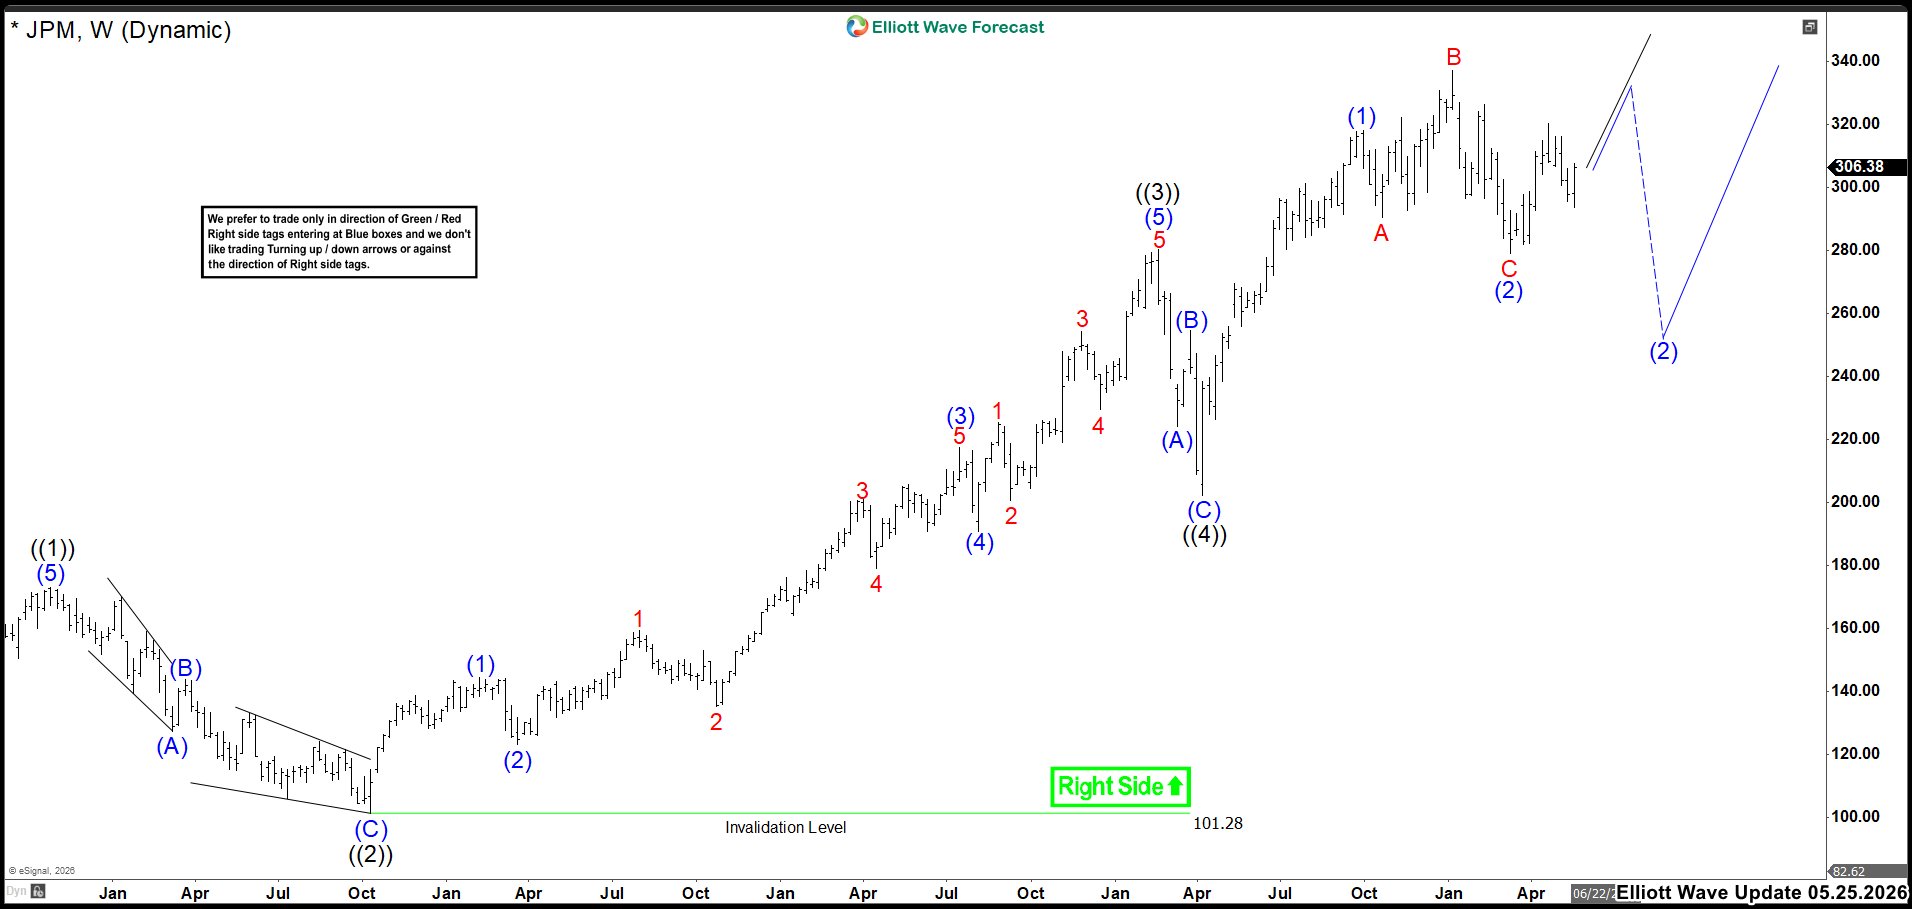
In this new update, we adjusted the count and now call wave (1) completed in September 2025. From that point, the market started a flat correction as wave (2), which ended at the 279.10 low. As long as price stays above that level, we continue to favor the bullish rally. Even so, the scenario remains unclear because wave (2) may still be incomplete.
If that happens, the market could follow the blue path. That view means wave (1) ended where we marked wave B and the market is still forming wave (2). Only a break below 279.10 would confirm that scenario. Until then, we maintain the most aggressive view, which becomes confirmed once price breaks to new all‑time highs.
Transform Your Trading with Elliott Wave Forecast!
Ready to take control of your trading journey? At Elliott Wave Forecast, we provide the tools you need to stay ahead in the market:
Blue Boxes: Stay ahead in the market with fresh 1-hour charts updated four times daily, daily 4-hour charts on 78 instruments, and precise Blue Box zones that highlight high-probability trade setups based on sequences and cycles.
Live Sessions: Join our daily live discussions and stay on the right side of the market.
Real-Time Guidance: Get your questions answered in our interactive chat room with expert moderators.
🔥 Special Offer: Start your journey with a 14-day trial for only $0.99. Gain access to exclusive forecasts and Blue Box trade setups. No risks, cancel anytime by reaching out to us at support@elliottwave-forecast.com.
💡 Don’t wait and get a DISCOUNT for any plan!
Click in the next link, go to Home Chat and ask for a flat discount code saying that you saw this in Luis’ Blog: 🌐


