

RVTY appears to still have several months to several years before completing the current bearish phase. This analysis could serve as a warning to new buyers to wait until the correction is over before going long. How much longer could this bearish phase continue? What support zone should traders expect before a fresh bullish cycle begins?
Revvity (RVTY) is a global life sciences and diagnostics company focused on improving human and environmental health. Previously part of PerkinElmer, Revvity provides advanced technologies, testing solutions, and software for applications in genomics, reproductive health, immunodiagnostics, and medical imaging. The company serves pharmaceutical, biotech, clinical, and research markets worldwide, continually expanding its role in precision medicine and laboratory innovation.
What’s been happening to RVTY?
RVTY has been in a bullish trend since its lowest price recorded in September 1974. At that low, it traded at just 43.7 cents. However, from that low, the stock rallied to its record peak of nearly $204, representing a gain of over 46,500%. The stock didn’t achieve this in one swing; it consistently moved higher, forming a sequence of higher highs and higher lows. With Elliott Wave theory, we can determine where it is in its overall trend. What’s perhaps more important is the current bearish correction that began from the all-time peak in December 2021.
Given the massive 46,500% gain, this stock likely appears on many traders’ watchlists. However, many might not know how to handle a deep bearish phase within such a significant bullish cycle. This post will use Elliott Wave analysis to determine the market stage of this bearish phase. Additionally, we can gain an understanding of where the pullback could end. Why is this important? It could help traders better position themselves for the next bullish phase.
RVTY Long Term Elliott Wave Analysis
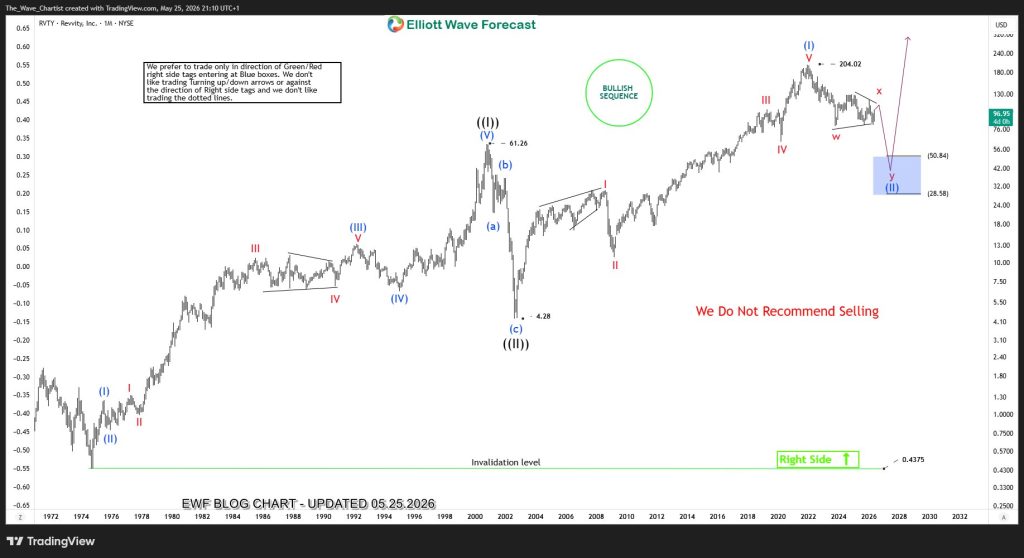
As the monthly chart above shows, RVTY rallied from $0.4375 to $61.26, completing the grand supercycle degree wave ((I)) in October 2000. A pullback emerged from what was the record top at the time to correct its 5-wave impulse structure. The pullback ended at $4.28 in August 2002, completing wave ((II)). From the low of August 2002, wave ((III)) started. After a 5-wave cycle from the August 2002 low to the December 2021 record peak, the stock completed wave (I) of ((III)). The current pullback from the record top represents wave (II) of ((III)). However, wave (II) doesn’t appear completed. After finishing a 3-swing decline, it went sideways. From an Elliott Wave perspective, the sideways structure appears to be a triangle pattern.
Triangles are corrective structures, consisting of 3 waves. When a 3-wave structure is followed by another 3-wave structure, the broader corrective structure is positioned to be a double correction, also known as a double zigzag structure. In the chart above, the price completed waves w and x of (II) with a zigzag and a triangle structure, respectively. Following the triangle structure should be another 3-wave structure lower for wave y of (II). Afterwards, the long-term bullish trend could resume. Using the Fibonacci forecasting tool, if the price completes the triangle and breaks lower as expected, the stock could plummet further to the $50.84 – $28.58 zone. In that zone, the stock could bottom and begin wave (III) of ((III)) to prices above $500. Thus, if you are considering going long on RVTY, it’s probably good to wait, as the low may still be a bit further away.
About Elliott Wave Forecast
At www.elliottwave-forecast.com, we update one-hour charts four times daily and four-hour charts once daily for all 78 instruments. We also conduct daily live sessions to guide clients on the right side of the market. Additionally, we have a chat room where moderators answer market-related questions. Experience our service with a 14-day trial for only $0.99. Cancel anytime by contacting us at support@elliottwave-forecast.com.




