

Reports surrounding the Iran negotiations continue to dominate global headlines as markets wait for clarity regarding a potential agreement. Officials from both sides have recently signalled that discussions remain active despite ongoing disagreements, keeping investors focused on the possibility of a diplomatic breakthrough.
The uncertainty has created sharp swings across commodities, currencies, and equity indices as traders attempt to position themselves ahead of a final outcome. Oil markets remain especially sensitive to every headline, while equities continue trying to price the probability of a broader Risk-On environment if an agreement is reached.
The Market is desperately waiting for news regarding the Iran Deal — either a deal gets finalized, or negotiations fail.
At ElliottWaveForecast.com , we always focus on anticipating the move rather than reacting to the headlines afterwards.
Video: Deal or No Deal
For years, we have maintained one of the more bullish long-term views across the Elliott Wave community because we let price action guide the analysis instead of opinions or news cycles. Elliott Wave Theory continues to demonstrate that markets move in repetitive cycles across every degree of trend.
Our team has expanded the traditional approach further through sequence analysis and the importance of High-Frequency areas (Blue Boxes). The key concept remains the same: trends unfold in repetitive sequences.
Within impulsive structures, markets tend to develop in sequences of: 5-9-13-17-21 swings.
Corrective structures usually unfold in: 3-7-11-15 swings.
The behavior repeats continuously across all timeframes and degrees.
A standard impulsive advance develops in five waves: ((i)), ((ii)), ((iii)), ((iv)), ((v))
Those five waves create wave 1 at the next degree, followed by a corrective structure into wave 2. The correction itself typically unfolds in 3, 7, or 11 swings. A simple correction is generally a 5-3-5 sequence. If the correction extends into 7 or 11 swings, the market continues connecting corrective structures while preserving the same internal rhythm.
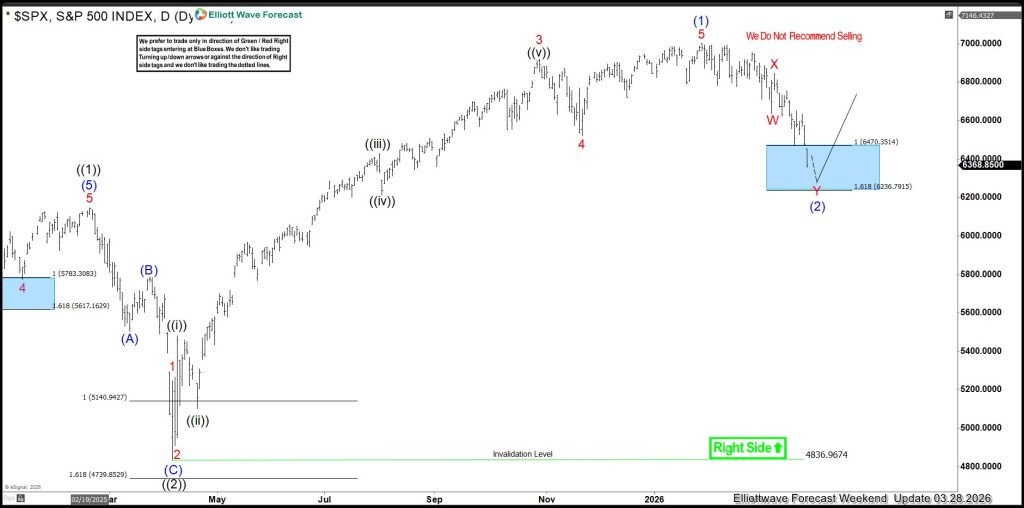
The Russell ($RTY) has been showing one of the cleanest bullish structures in the market since the 03.30.2026 low — the same date the broader market reached our Blue Box buying area, as shown in the $SPX Daily chart before breaking into new all-time highs.
SPX Daily Chart March 28 2026
The big question now is: What happens next?
Most participants are focused entirely on the geopolitical outcome:
Deal completed = Risk On
No Deal = Risk Off
However, when we step away from the headlines and focus strictly on structure, we find that $RTY continues to display a very clean impulsive advance from the 03.30.2026 low.
The rally completed a textbook five-wave structure, followed by an 11-swing WXY correction that reacted perfectly from our Blue Box (High-Frequency) area presented to members.
RTY_F 1 Hour Chart May 25 2026
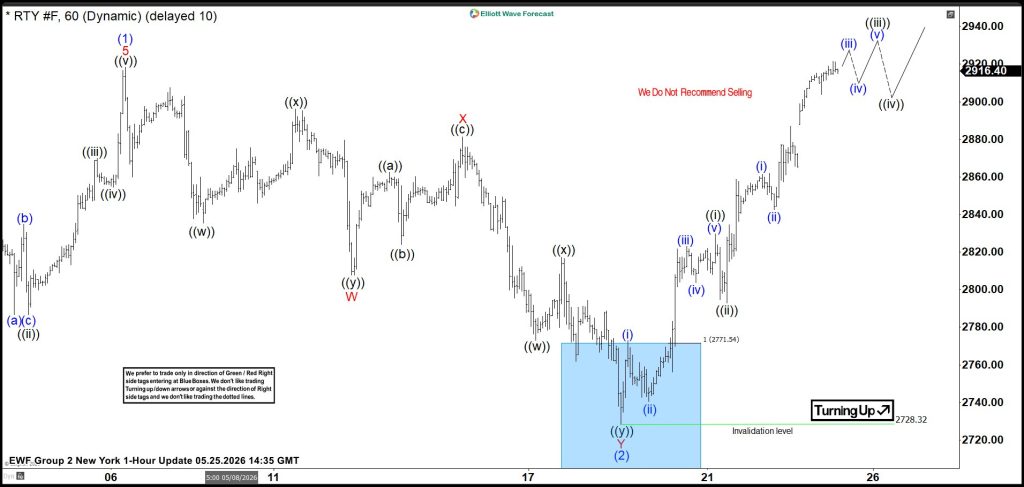
More importantly, when relating the 03.30.2026 low with the 05.18.2026 low, the market continues to maintain a bullish sequence. That higher-degree bullish sequence strongly suggests continuation higher remains the preferred path.
RTY_F 4 Hour Chart May 25 2026
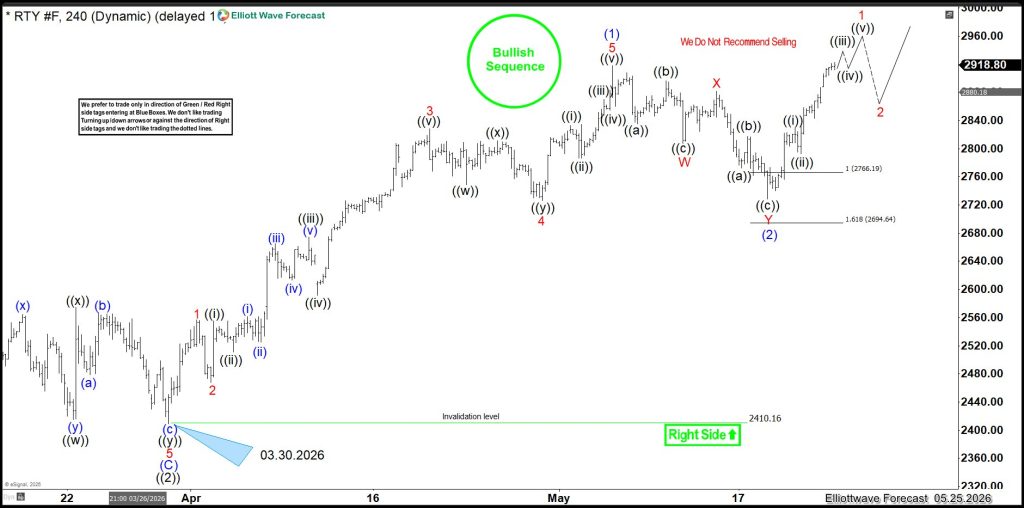
The alternative scenario would require the market to be developing a larger FLAT correction from the peak of wave (1), but at this stage that remains the lower probability outcome.
The current $RTY 1H and 4H structures continue to support the same conclusion:
The market price action is behaving as if a deal is eventually expected.
Whether the official confirmation comes tomorrow or later is secondary. The structure itself continues pointing toward higher prices unless the bullish sequence breaks, and at this stage the market continues favoring the scenario that a deal will eventually happen.


