Goldman Sachs (NYSE: GS) displays a strong weekly bullish sequence. Today, we explore the Elliott Wave pattern behind this move. Our analysis highlights potential paths and targets for continued momentum.
Elliott Wave Analysis
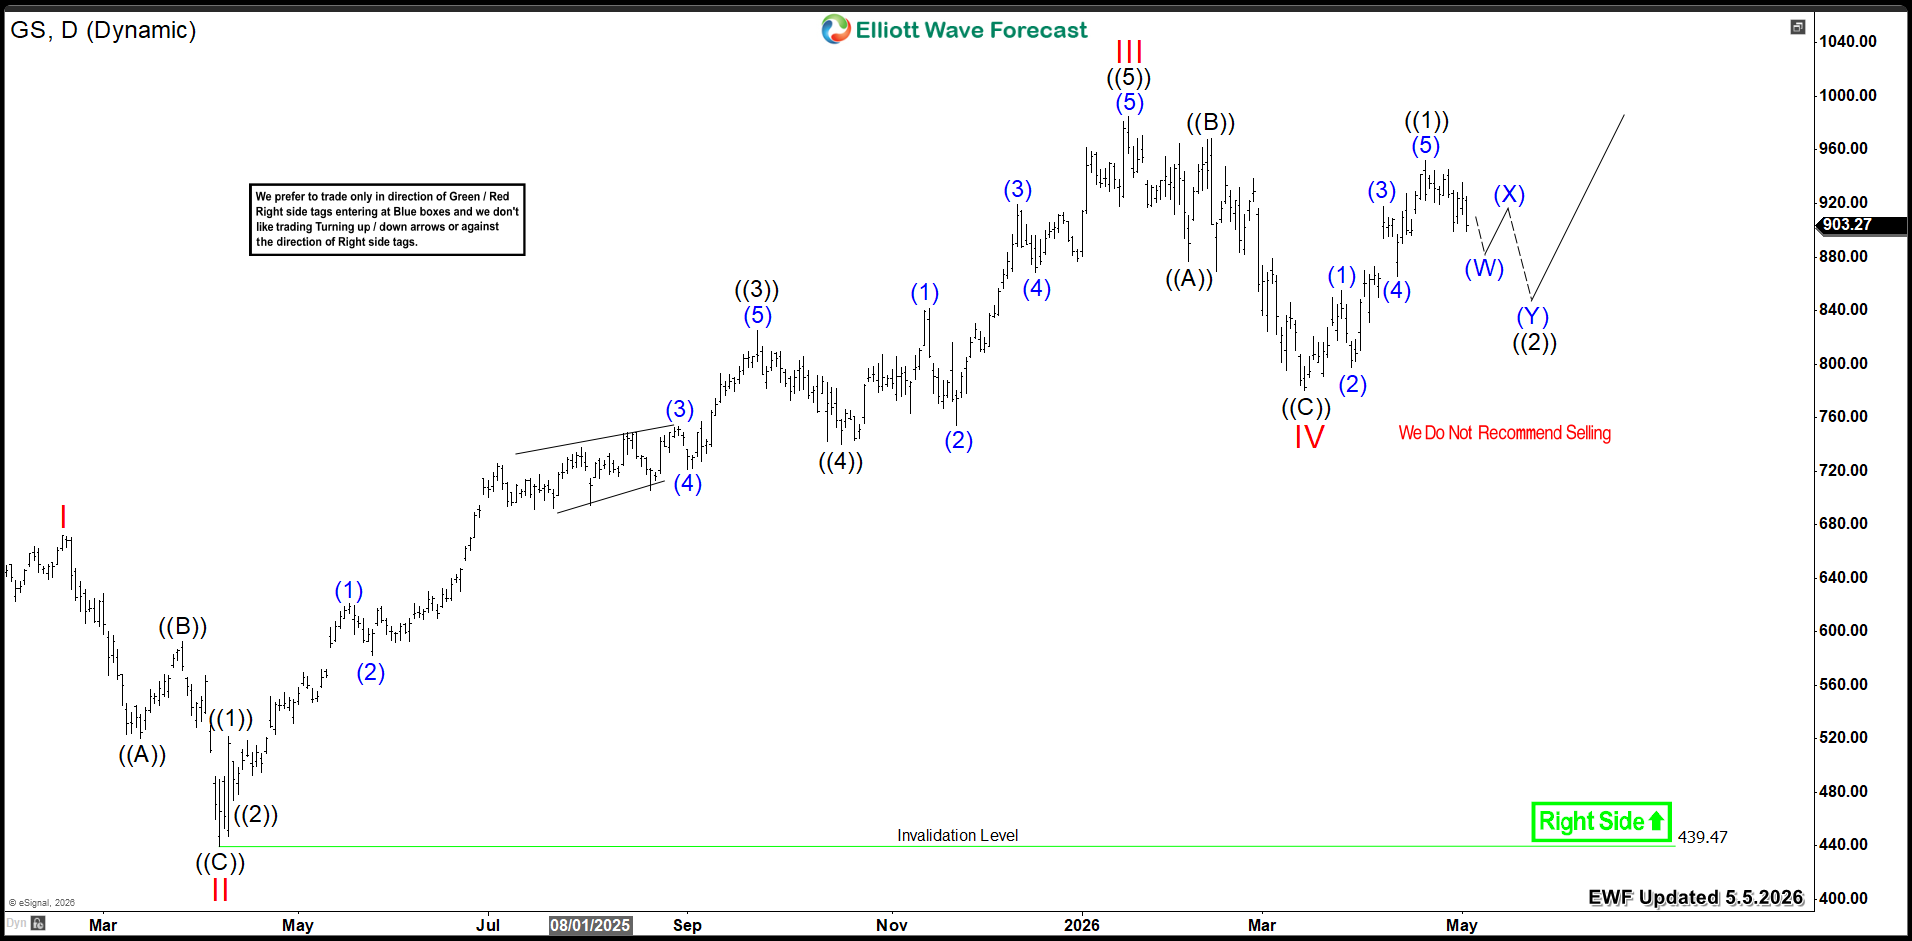
Goldman Sachs Daily Chart 5.5.2026
The following video offers a technical outlook for GS Corporation:
Conclusion
Goldman Sachs’s bullish cycle suggests further continuation toward the $1000 milestone. Consequently, investors should target buying opportunities within weekly and daily pullbacks. Utilize our Elliott Wave strategy for precise entry timing.
Get More Insights Today
Learn to trade our Blue Boxes using the 3, 7, or 11 swings sequence. Try our services with a 14-day trial.
You will gain access to:
-
78 instruments updated across 4 different time frames
-
Live Trading & Analysis Sessions with our Expert Analysts every day
-
24-hour chat room support and much more
Explore our system to gain deeper insights into this methodology.


