McDonald’s (MCD) enters the second quarter with steady momentum as the stock trades near 307. Moreover, recent performance shows resilient demand despite a slower consumer environment. However, investors still want stronger comparable sales before supporting a sustained breakout. Therefore, the 320 level remains the key resistance for confirming a broader bullish continuation.
Looking ahead, analysts expect moderate revenue growth supported by digital expansion and stable margins. Additionally, the company benefits from consistent global traffic, which strengthens the quarterly outlook. Consequently, price action may push toward 340 if market conditions remain favorable. Ultimately, the trend stays constructive while the stock holds above the 300-support zone.
Elliott Wave Outlook: McDonald’s MCD Weekly Chart December 2025

After several months, MCD prices action stayed stable without meaningful variation. Consequently, this stability suggested the market was forming a triangle or a bullish nest. We adopted the triangle scenario because we believed the April 2025 cycle was nearly complete. If this view was correct, it would deliver a correction shown on the chart as wave ((2)).
Meanwhile, we looked for one more high to complete wave ((1)), so price needed to hold above 283.63. This level supported our primary idea of targeting another high near 336.36. Finally, we monitored the market for a bearish reaction that could signal the end of wave ((1)) and the start of a possible correction.
(If you want to learn more about Elliott Wave Principle, please follow these links: and .)
Elliott Wave Principle Behind the Market Structure
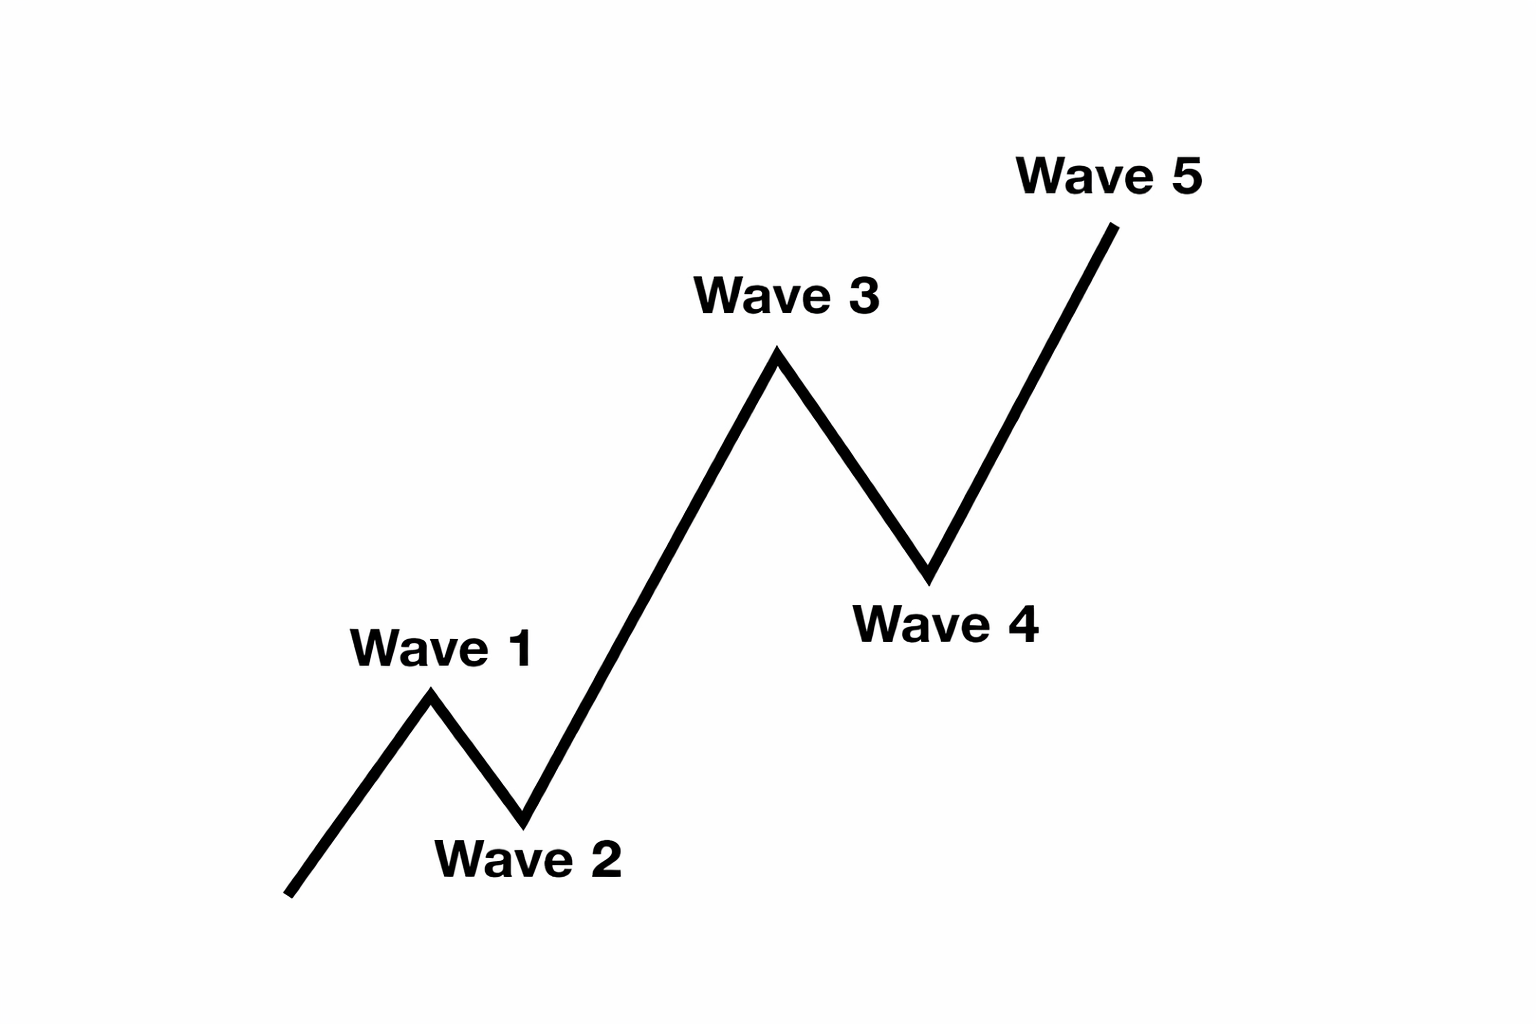
Impulse
An impulse is a clean 5‑wave pattern that drives the trend forward.
- Waves 1‑3‑5 are strong and directional.
- No overlap between waves 1 and 4.
- Wave 3 is usually the strongest.
- Structure is clear, with increasing momentum.
Elliott Wave Outlook: McDonald’s MCD Weekly Chart April 2026

Transform Your Trading with Elliott Wave Forecast!
Ready to take control of your trading journey? At Elliott Wave Forecast, we provide the tools you need to stay ahead in the market:
Blue Boxes: Stay ahead in the market with fresh 1-hour charts updated four times daily, daily 4-hour charts on 78 instruments, and precise Blue Box zones that highlight high-probability trade setups based on sequences and cycles.
Live Sessions: Join our daily live discussions and stay on the right side of the market.
Real-Time Guidance: Get your questions answered in our interactive chat room with expert moderators.
🔥 Special Offer: Start your journey with a 14-day trial for only $0.99. Gain access to exclusive forecasts and Blue Box trade setups. No risks, cancel anytime by reaching out to us at support@elliottwave-forecast.com.
💡 Don’t wait and get a DISCOUNT for any plan!
Click in the next link, go to Home Chat and ask for a flat discount code saying that you saw this in Luis’ Blog: 🌐


