5 Wave Impulse + 7 Swing WXY correction

$AMZN Daily Elliott Wave Chart 2.08.2026:
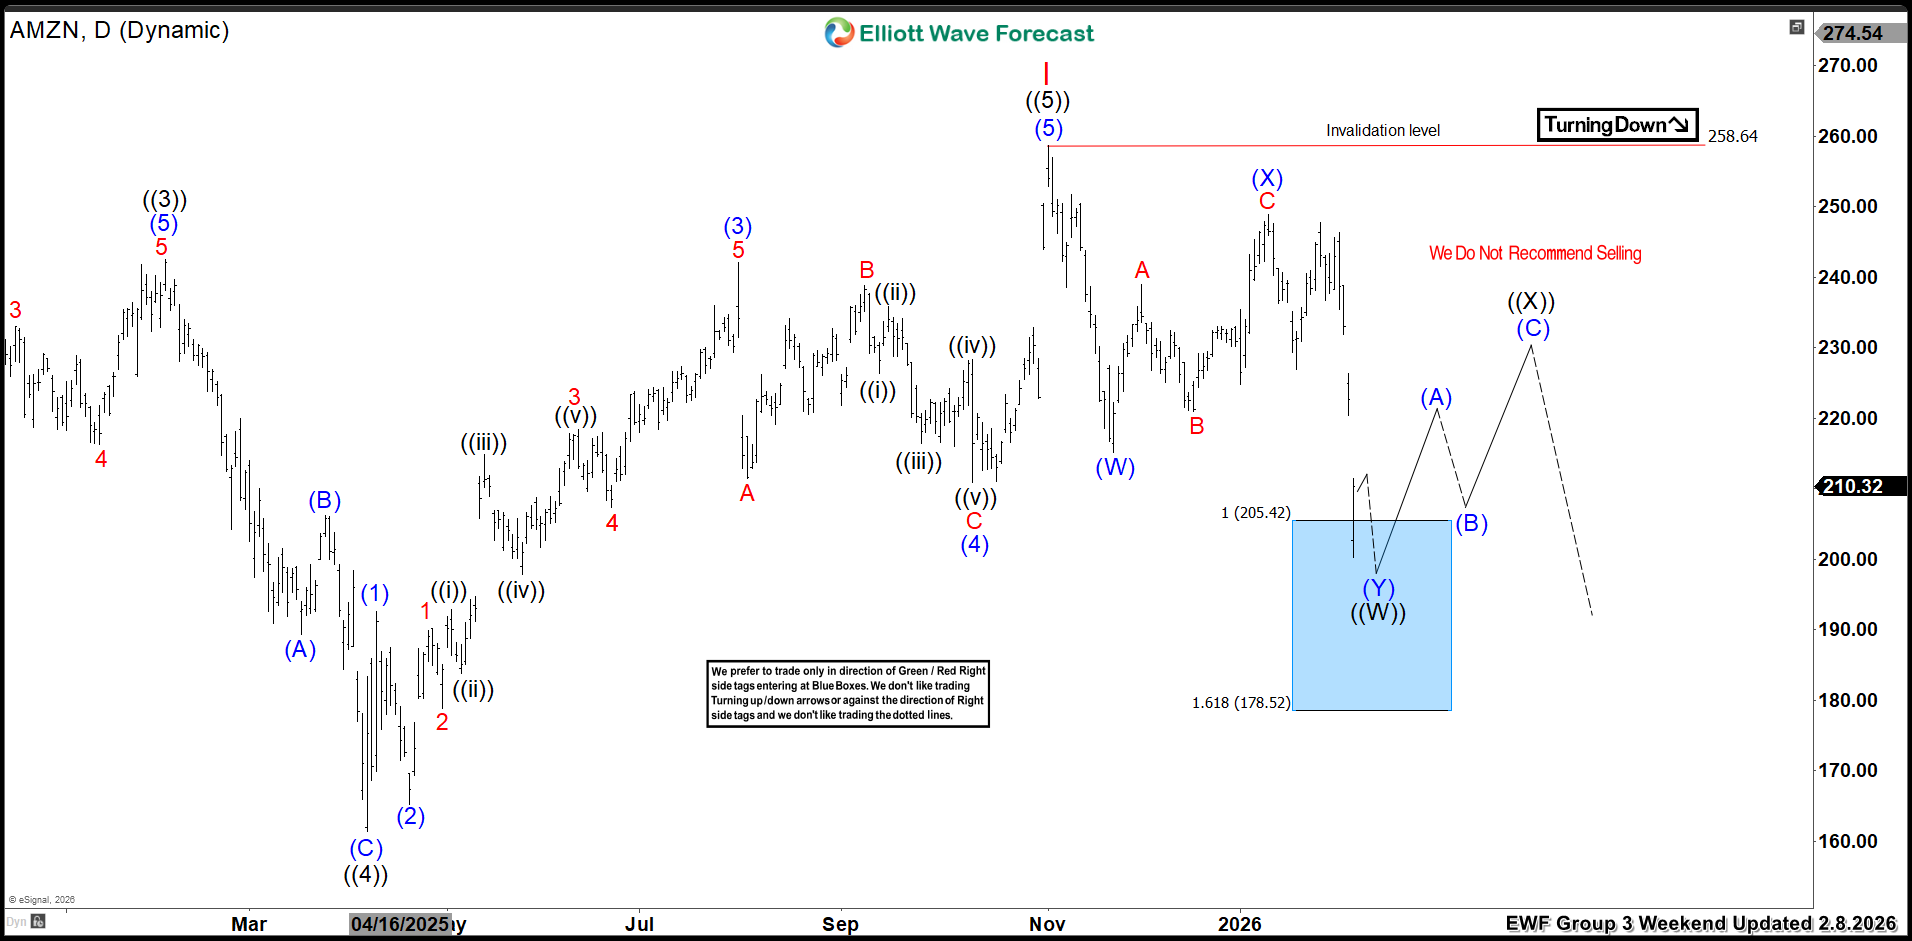 In the daily Elliott Wave count from Feb 08, 2026, we saw that $AMZN completed a 5-wave impulsive cycle from Apr 2025 low at red I. We anticipated this pullback to unfold in 7 swings, likely finding buyers in the blue box area between $205.42 and $178.52.
This setup aligns with a typical Elliott Wave correction pattern (WXY), in which the market pauses briefly before resuming its primary trend.
$AMZN Daily Elliott Wave Chart 3.01.2026:
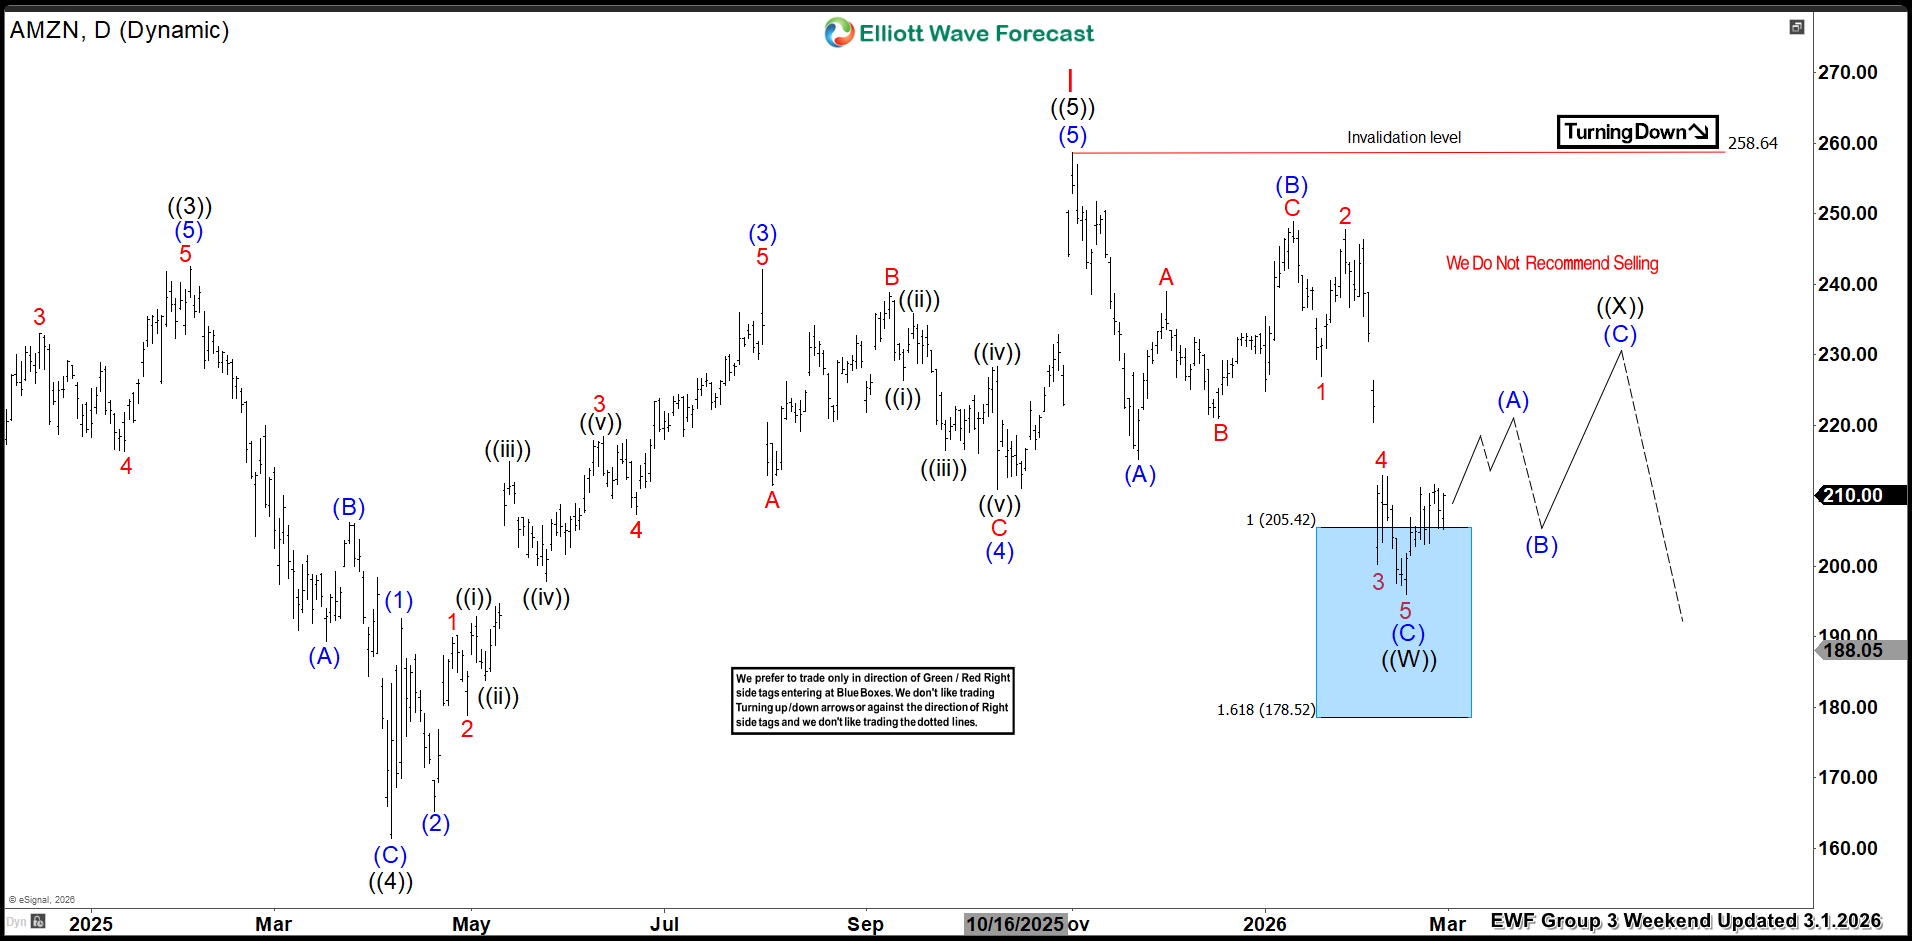 The latest daily update, from Mar 01, 2026, shows that the stock bounced as expected allowing traders to get risk free. Currently, it is trading higher in wave (A) of ((X)), a 3 swing bounce (ABC), to correct the decline from Nov 2025 peak before continuing lower in wave ((Y)) of II .
Conclusion
To conclude, our Elliott Wave analysis of Amazon.com Inc ($AMZN) suggests that it remains supported in the near term for at least 3 swings up against recent Feb 2026 lows. Thus, traders that bought the blue box should get risk free by booking half profits and moving the stop loss to the recent low. Additionally, keep an eye out for any corrective pullbacks that may offer entry opportunities.
By applying Elliott Wave Theory, traders can better anticipate the structure of upcoming moves and enhance risk management in volatile markets.
$AMZN Elliott Wave Video Analysis
Elliott Wave Forecast
We cover 78 instruments, but not every chart is a trading recommendation. We present Official Trading Recommendations in the Live Trading Room. If not a member yet, Sign Up for 14 days Trial now and get access to new trading opportunities.
Welcome to Elliott Wave Forecast!


