

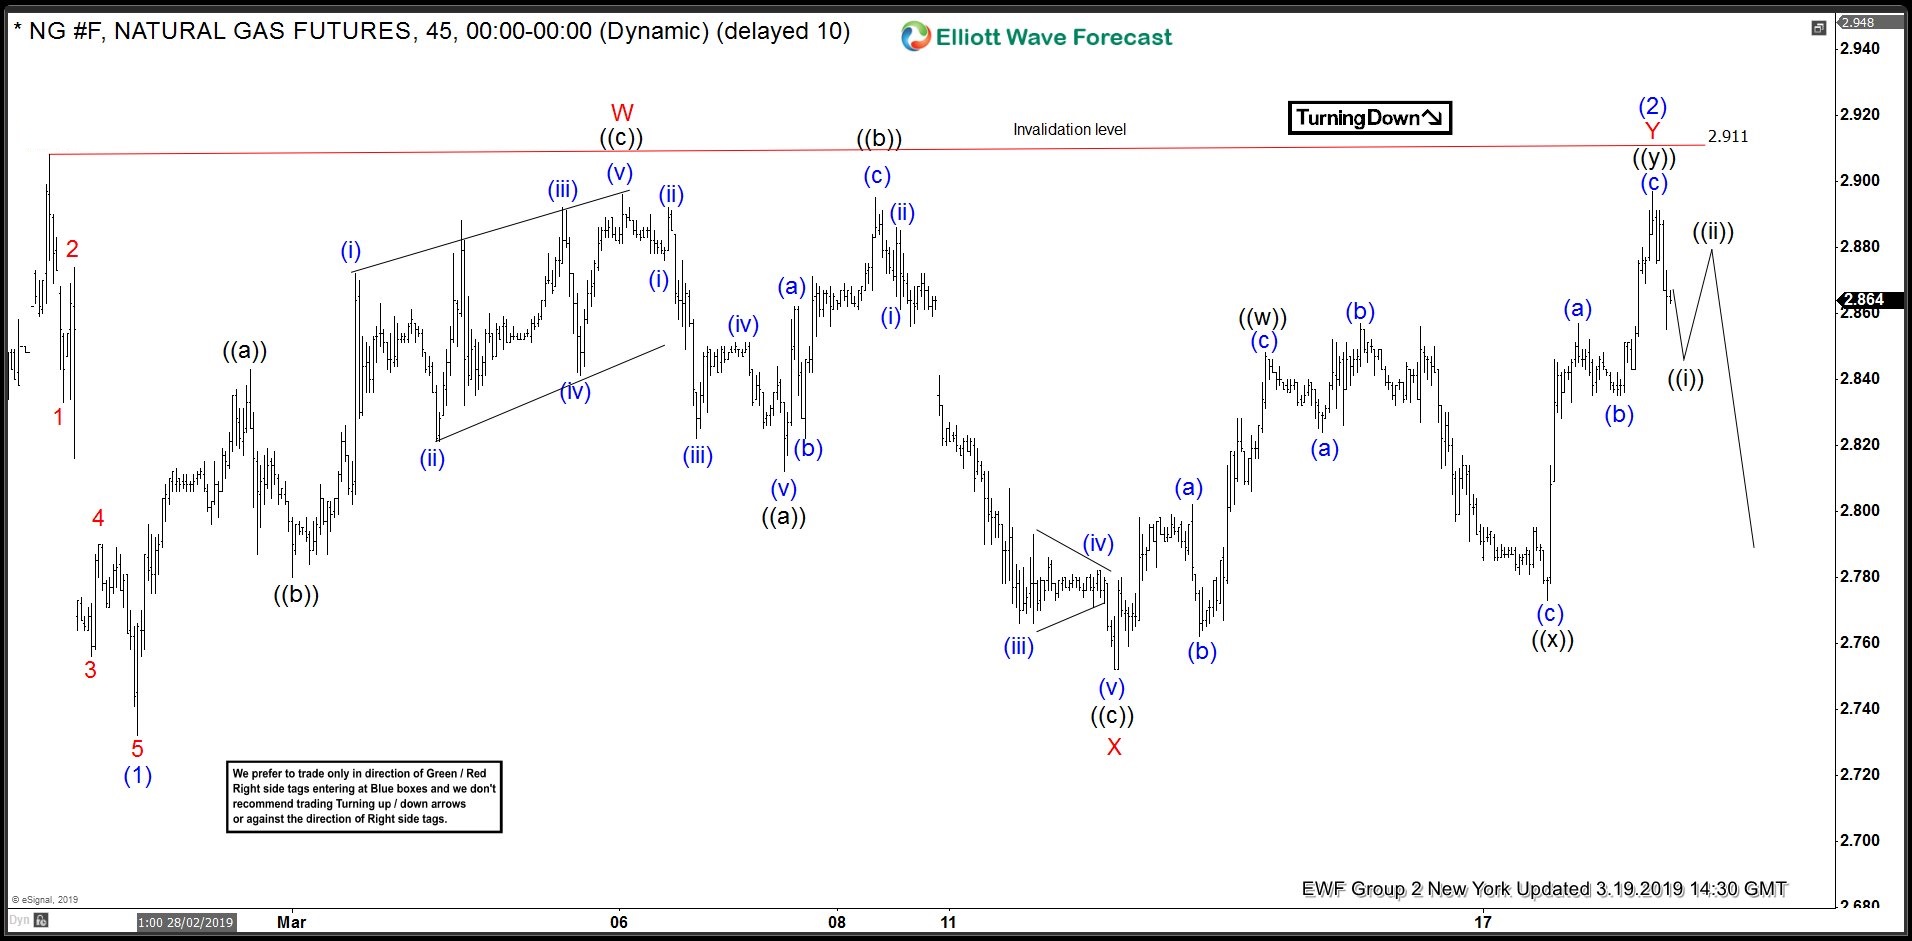
Hello fellow traders. In this technical blog we’re going to take a quick look at the charts of Natural Gas published in members area of the website. As our members know, we were calling February cycle completed at the 2.911 peak. The Futures made very sideways recovery against the mentioned peak, that unfolded as Elliott Wave Double Three Pattern. We advised clients to avoid trading Natural Gas due to tricky sideways structure. Anyway, we were calling for further weakness as far as the price stays below 2.911 peak.
In the charts below, we’re going to explain the Elliott Wave structure and forecast.
Natural Gas Elliott Wave 1 Hour Chart 3.19.2019
The Commodity has made Elliott Wave Double Three Recovery against the 2.911 peak. Correction’s subdivisions are labeled as WXY red. If we take a closer look, we can notice that waves W and X have unfolded as Elliott Wave Zig Zags: ((a))((b))((c)), while Y red is also Double Three : ((w))((x))((y)). We’re calling correction completed at 2.898 peak.
Double three is the most important pattern in New Elliott Wave theory and probably the most common pattern in the market these days, also known as 7 swing structure. Elliott Wave Double Three has (W),(X),(Y) labeling and 3,3,3 inner structure, which means all of these 3 legs are corrective sequences. You can learn more about Double Three Pattern at our Elliott Wave Educational Web Page.
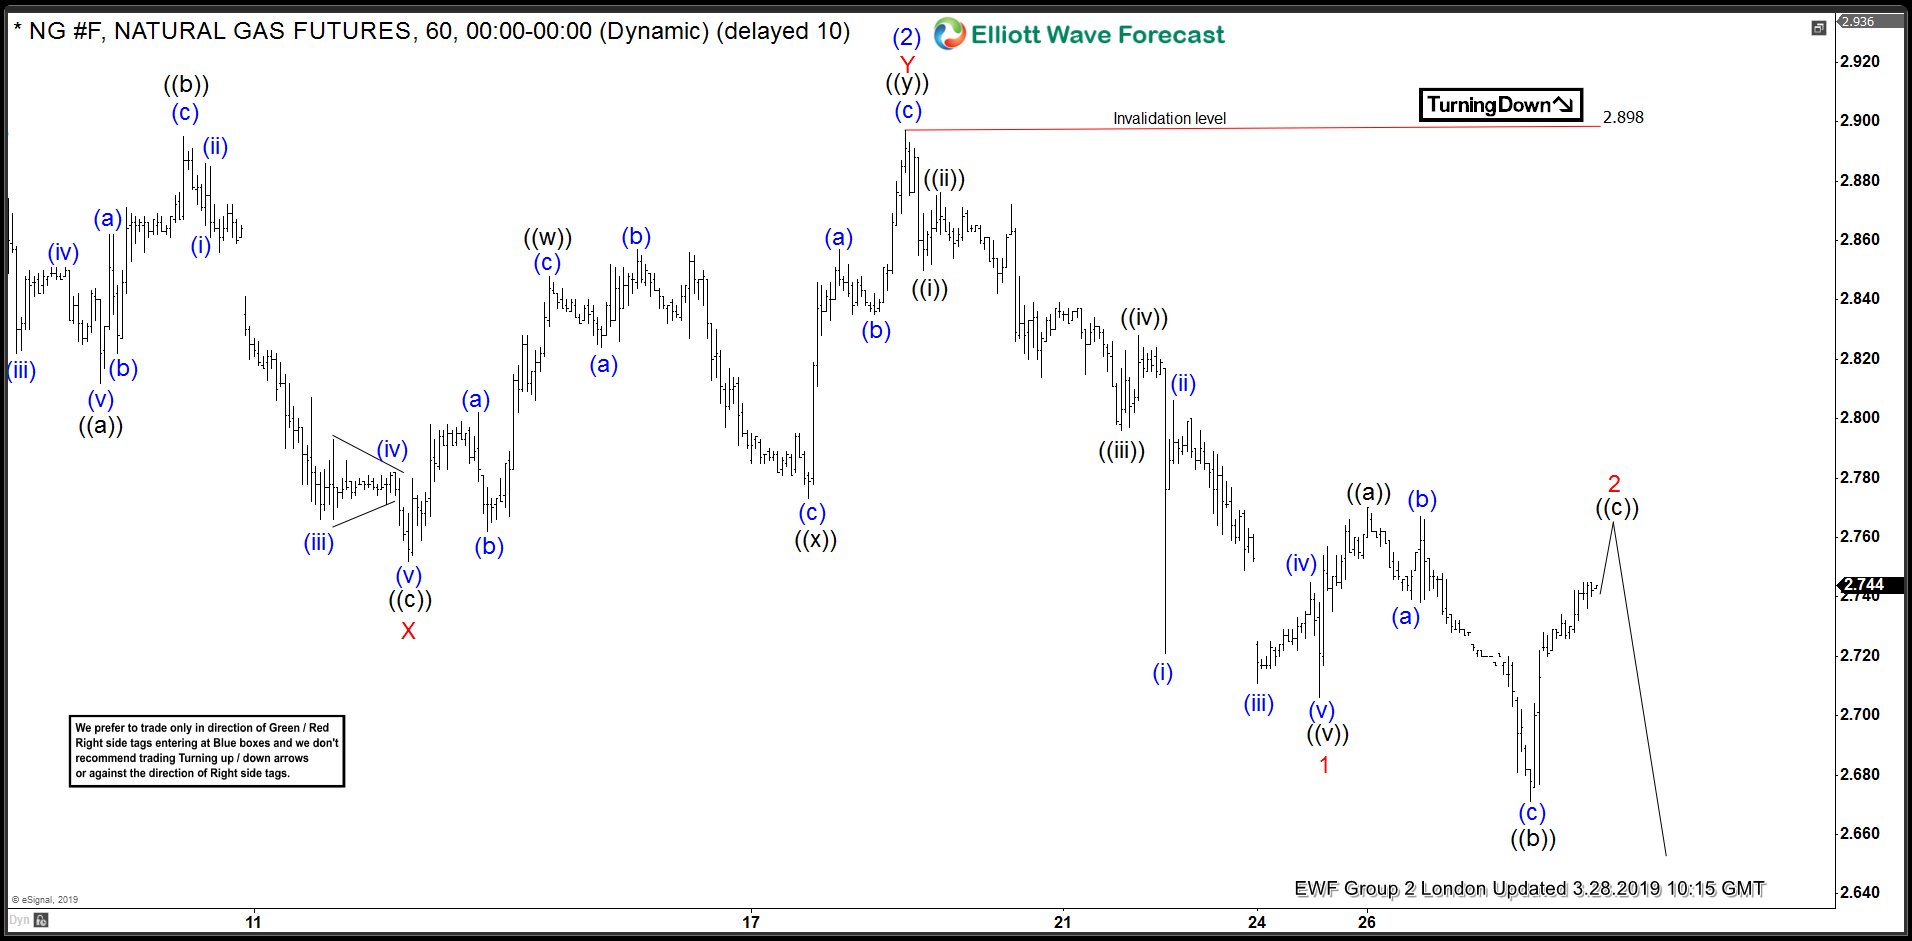
Natural Gas Elliott Wave 1 Hour Chart 3.28.2019
2.898 high held nicely, and we got expected decline. We got 5 waves down from the 2.898 peak, and currently correcting that cycle. Short term recovery is unfolding as Irregular Flat Pattern, labeled as wave 2 red. Once bounce completes we expect more downside in Natural Gas.
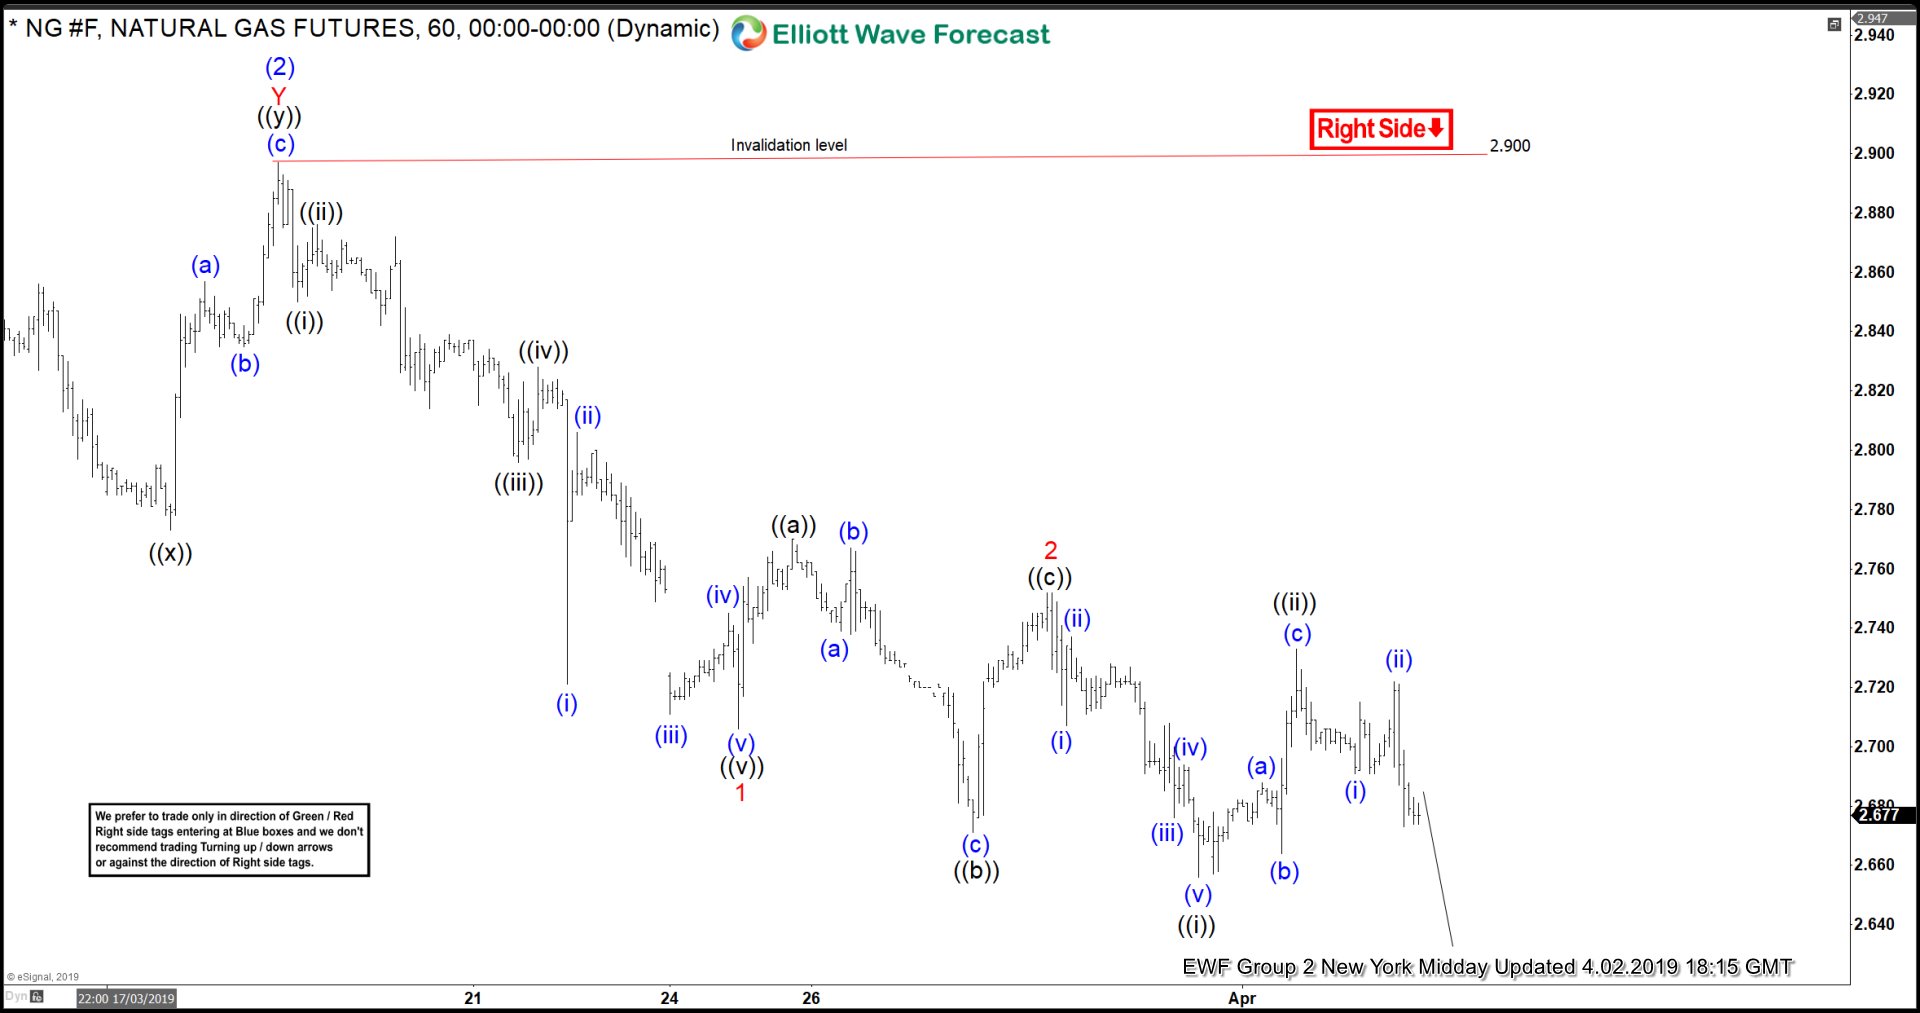
Natural Gas Elliott Wave 1 Hour Chart 4.02.2019
Finally wave 2 red ended as Running Flat and we got new short term low. Cycle from the 2.899 peak is incomplete now, the price is showing lower low sequences. Consequently , as far as the price stays below wave 2 red high, we should be ideally doing next leg lower.
Keep in mind market is very dynamic and proposed view could have ended in the mean time. You can check most recent updates in the Membersip Area of the Website . Best instruments to trade are those having incomplete bullish or bearish swings sequences. We put them in Sequence Report and best among them are shown in the Live Trading Room.
Elliott Wave Forecast Membership
Trade with a clear plan. Trade with confidence.
Our team of professional analysts monitors 78 instruments across global markets every trading day, helping members identify high-probability setups, define risk before entering, and manage positions with a structured, rules-based approach.
Inside your membership, you’ll receive:
✅ Real-Time Trading Recommendations — clearly defined Entry, Stop Loss, and Take Profit levels for every setup.
✅ Live Trading Room Access — follow professional setups and trade management as they develop in real time.
✅ 24-Hour Analyst Support — ask unlimited questions and get expert guidance throughout the trading week.
✅ Expert Multi-Market Analysis — covering Forex, Stocks, Indices, ETFs, Commodities, and Cryptocurrencies.
✅ Education Built Into Every Setup — learn how experienced analysts identify opportunities, define risk, and manage positions. Exclusive educational videos are included at no additional cost.
Stop reacting after the market moves. Start preparing before it does.
See the setups our analysts are watching, follow the market in real time, and learn the strategy behind each trade.
Your membership starts with just a few clicks.
Regular 14-Day Trial: $9.99
Limited-Time Price: Only $0.99
👉 Start Your 14-Day Trial for Only $0.99





