Shopify’s (SHOP) stock has been experiencing a bit of a downturn recently, and investors are eager to see what the second and third quarters of the year will hold. Analysts expect that the company will focus on refining its e-commerce tools and expanding its merchant solutions. Consequently, there’s a sense of cautious optimism that these efforts might help stabilize the stock’s performance.
In addition, as we move further into the year, investors are keeping an eye on how macroeconomic trends will impact the broader e-commerce sector. Therefore, Shopify is likely to adapt its strategies to maintain a competitive edge. Altogether, these elements could influence the stock’s trajectory and shape how it performs in the upcoming months.
Elliott Wave Outlook: SHOP Daily Chart December 2025
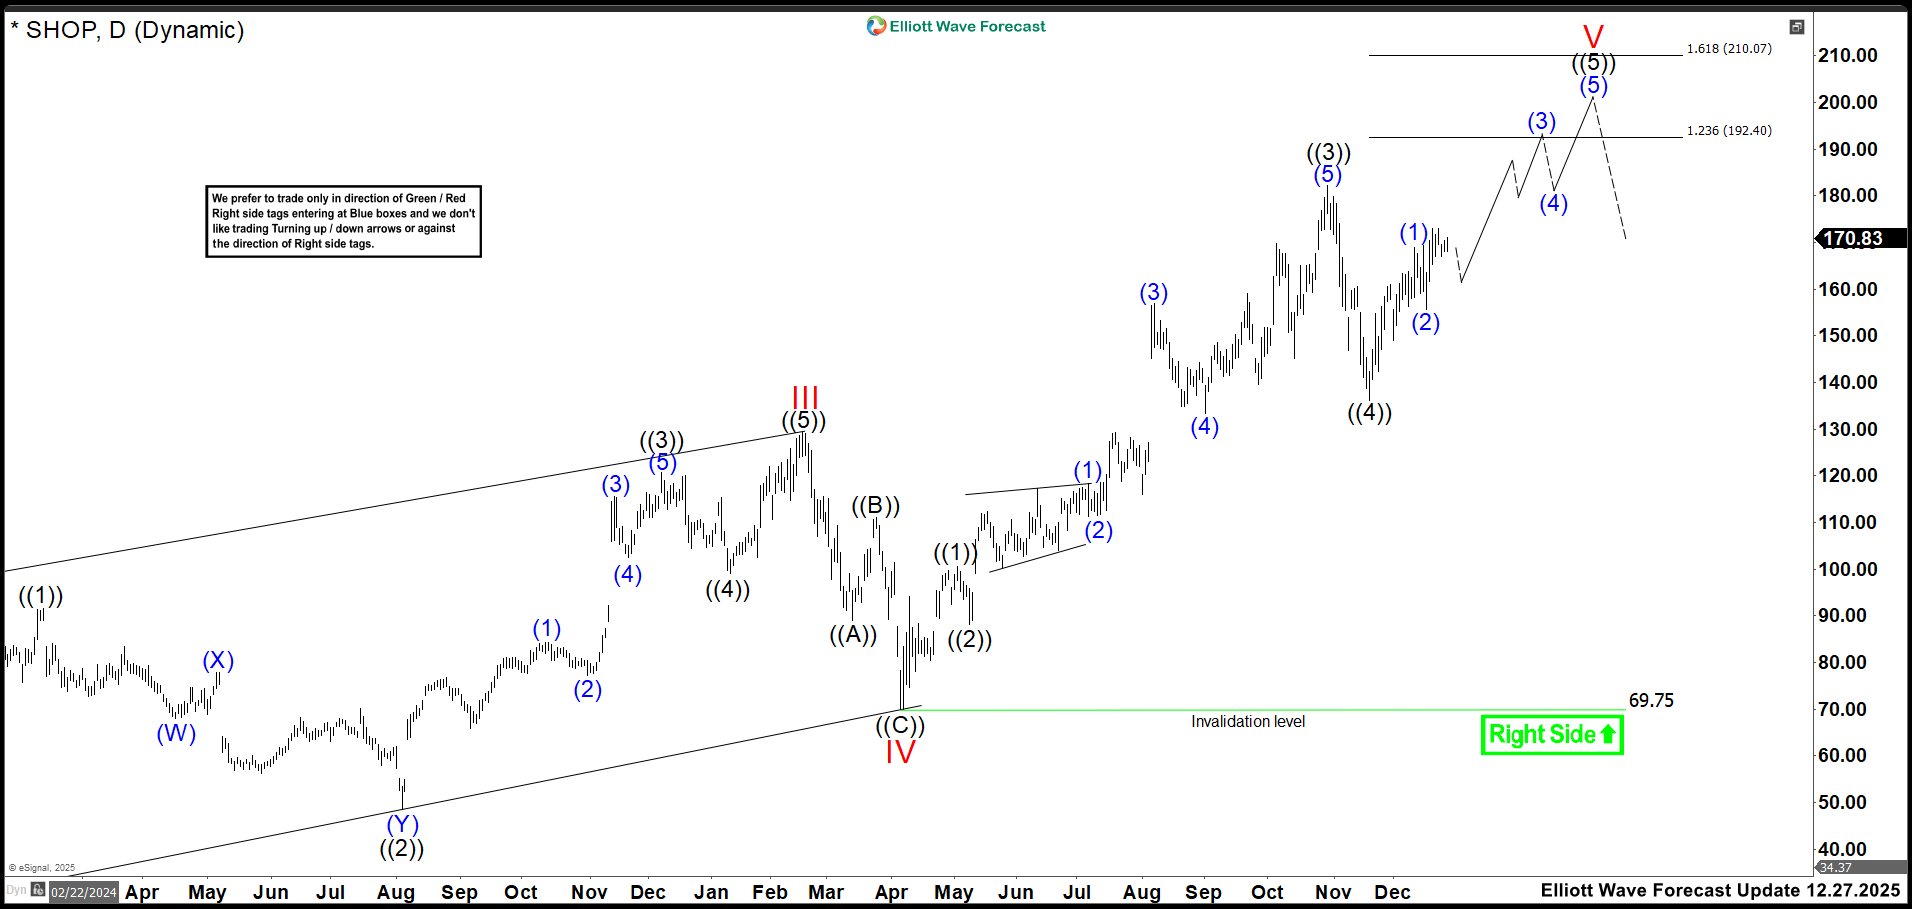
Last update, we showed that price resumed its advance in wave (5) of ((3)) after completing wave (4). Then, it hit a high of 182.19 in October and corrected sharply, dropping 25% to 136.18. Afterward, we expected the market to build an impulse as wave ((5)) of V to complete the cycle from November. This move could reach the 192.40–210.07 zone, where strong selling pressure may appear.
Therefore, the strategy remained simple and consistent: buy the dips until price reached the next zone. Additionally, we planned to evaluate the reaction once price touched that area. The outlook stayed valid as long as the market held above the wave (4) low.
Elliott Wave Principle Behind the Market Structure
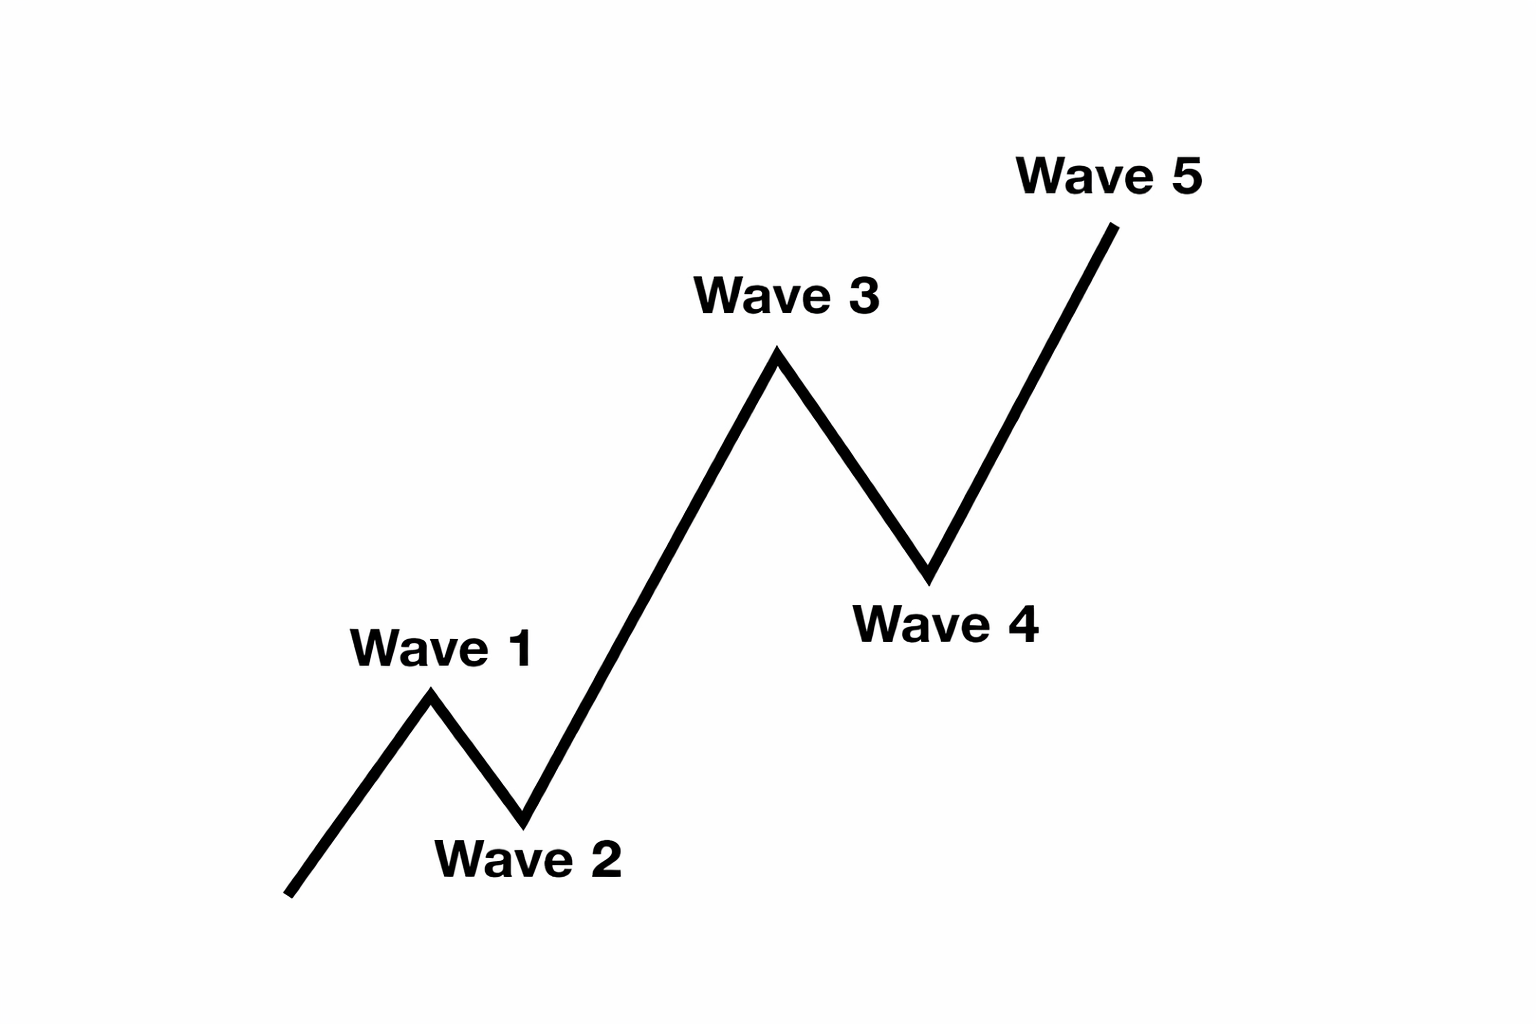
Impulse
An impulse is a clean 5‑wave pattern that drives the trend forward.
- Waves 1‑3‑5 are strong and directional.
- No overlap between waves 1 and 4.
- Wave 3 is usually the strongest.
- Structure is clear, with increasing momentum.
Elliott Wave Outlook: SHOP Daily Chart April 2026
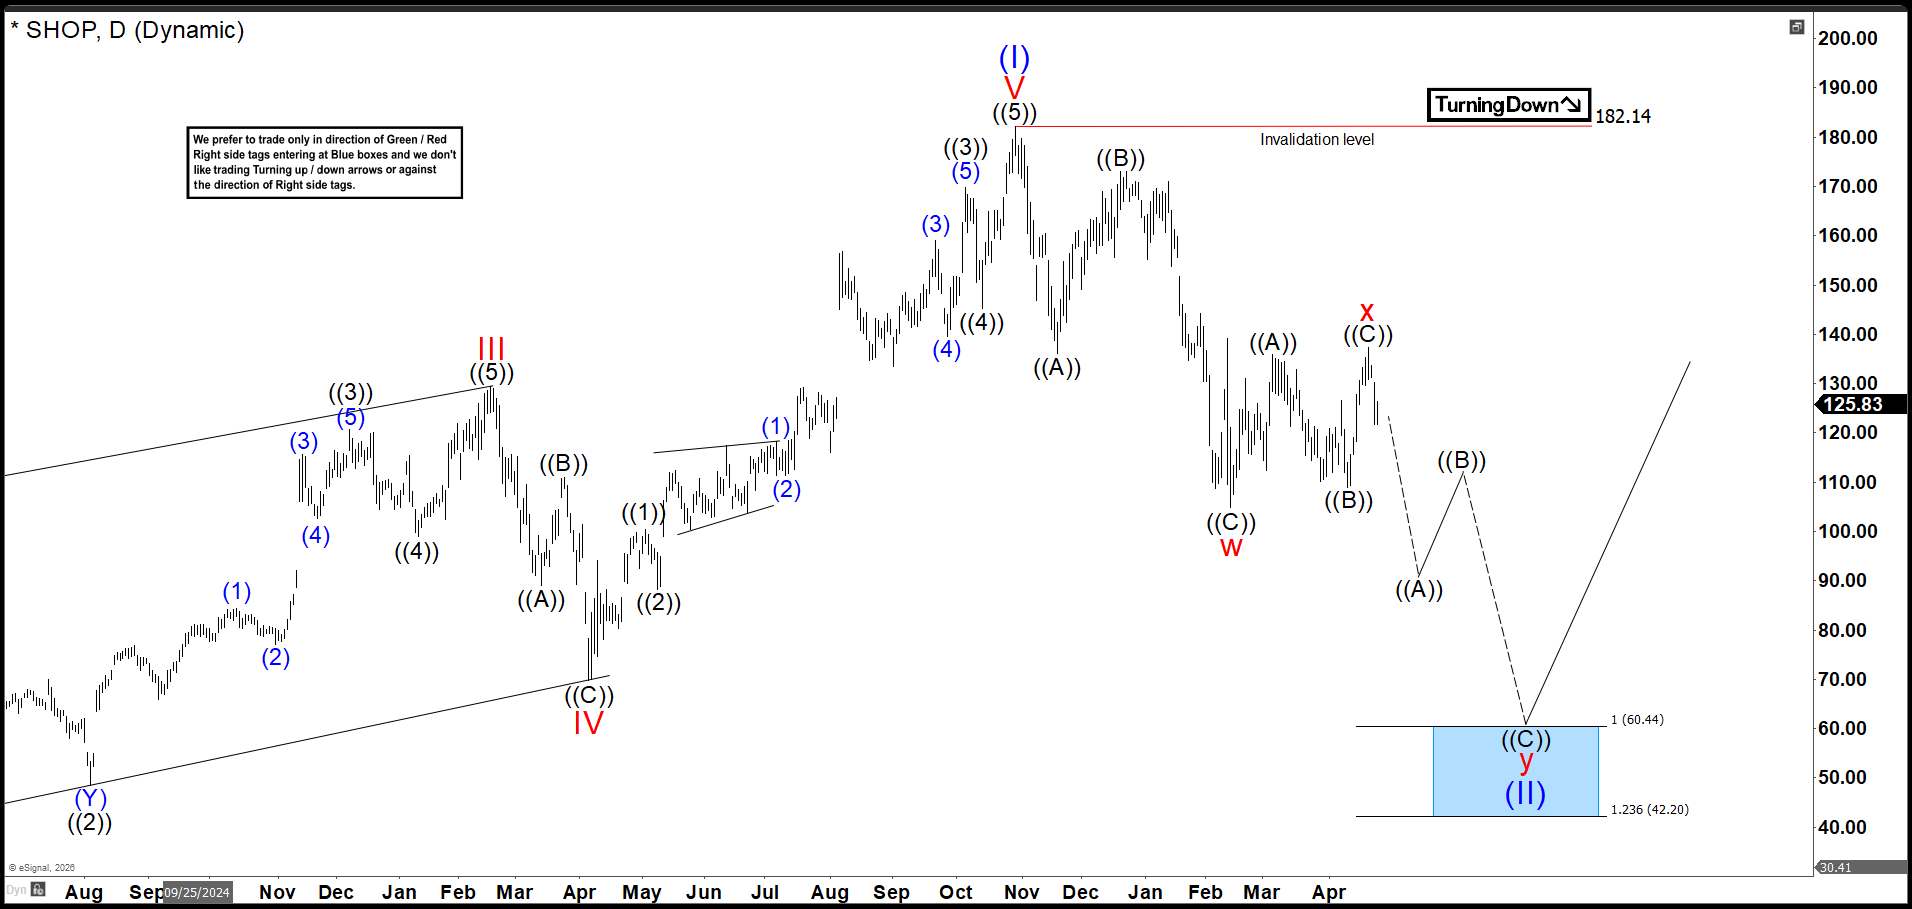 In this new update, the market continues lower and breaks the possible wave ((4)), suggesting the end of the cycle in SHOP. Therefore, we adjust the impulse as shown in the chart. Wave ((3)) ended at 169.69, and wave ((4)) ended at 151.30 before the final rally toward 182.69 to complete wave (I). Moreover, price action has already finished three waves lower as wave w and attempted a bullish reaction. However, the rebound shows weak traction, so the market may form a double correction as wave (II).
To confirm this view, price must break the February low and hold below it. Such action would confirm the double correction toward 60.44–42.20. Conversely, if the market breaks below 104.92 but price remains lagging, the correction may become truncated, and SHOP shares may continue the rally from the 90.00–70.00 zone. Consequently, price action after a break of the 104.92 low becomes extremely important.
Transform Your Trading with Elliott Wave Forecast!
Ready to take control of your trading journey? At Elliott Wave Forecast, we provide the tools you need to stay ahead in the market:
Blue Boxes: Stay ahead in the market with fresh 1-hour charts updated four times daily, daily 4-hour charts on 78 instruments, and precise Blue Box zones that highlight high-probability trade setups based on sequences and cycles.
Live Sessions: Join our daily live discussions and stay on the right side of the market.
Real-Time Guidance: Get your questions answered in our interactive chat room with expert moderators.
🔥 Special Offer: Start your journey with a 14-day trial for only $0.99. Gain access to exclusive forecasts and Blue Box trade setups. No risks, cancel anytime by reaching out to us at support@elliottwave-forecast.com.
💡 Don’t wait and get a DISCOUNT for any plan!
Click in the next link, go to Home Chat and ask for a flat discount code saying that you saw this in Luis’ Blog: 🌐


