

Hello fellow traders. In this technical article we’re going to look at the Elliott Wave charts of NIFTY Index published in members area of the website. As our members know , the Index shows incomplete sequences in the cycle from the 26281.55 peak. The price structure calls for further weakness in NIFTY. The index is targeting 21836 area, where we like to be buyers again. In the following text, we will explain the Elliott Wave forecast in more detail.
NIFTY 1-Hour Elliott Wave Chart: February 9, 2025
As mentioned earlier, NIFTY is showing bearish sequences in the cycle from the 26281.55 peak, and we expect further weakness in the index. Current Elliott Wave analysis suggests that NIFTY completed a three-wave recovery at the 23806.54 high. As long as the price remains below this level, we anticipate continued downside in NIFTY.
At this stage, we do not recommend forcing trades. The strategy is to wait for the extreme zone to be reached before considering a buying opportunity.
Learn Elliott Wave Patterns
90% of traders fail because they don’t understand market patterns. Are you in the top 10%? Test yourself with this advanced Elliott Wave Test
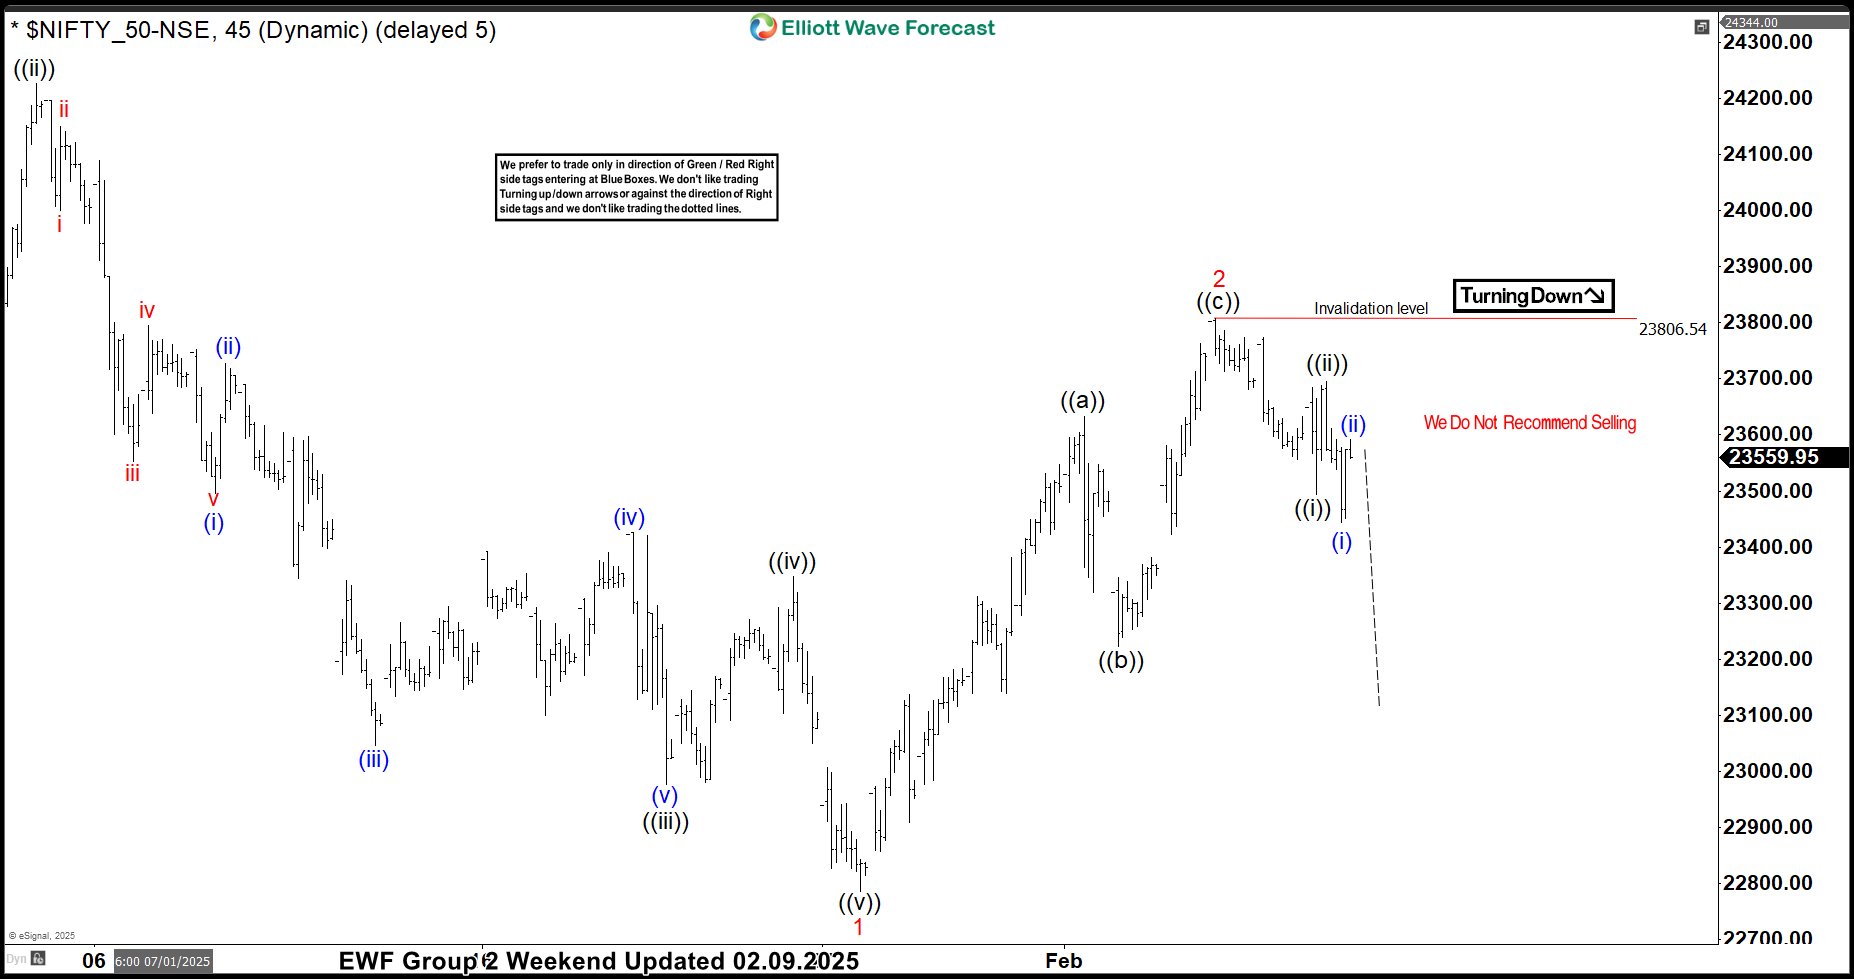
NIFTY 1-hour chart showing incomplete bearish sequences from 26281.55 peak
NIFTY 1-Hour Chart Update: February 12, 2025
The price made further separation from the 23808.4 peak and retested the previous low at 1 red. To confirm further downside within the proposed cycle, we would like to see a break below the January 27th low. A break of this level would increase the likelihood of an extension towards our target area at 21836, where we are interested in buying again.
Remember, the market is dynamic, and the presented view may have changed in the meantime. For the most recent charts and target levels, please refer to the membership area of the site. The best instruments to trade are those with incomplete bullish or bearish swing sequences. We put them in Sequence Report and best among them are presented in the Live Trading Room
Reminder for members: Our chat rooms in the membership area are available 24 hours a day, providing expert insights on market trends and Elliott Wave analysis. Don’t hesitate to reach out with any questions about the market, Elliott Wave patterns, or technical analysis. We’re here to help.
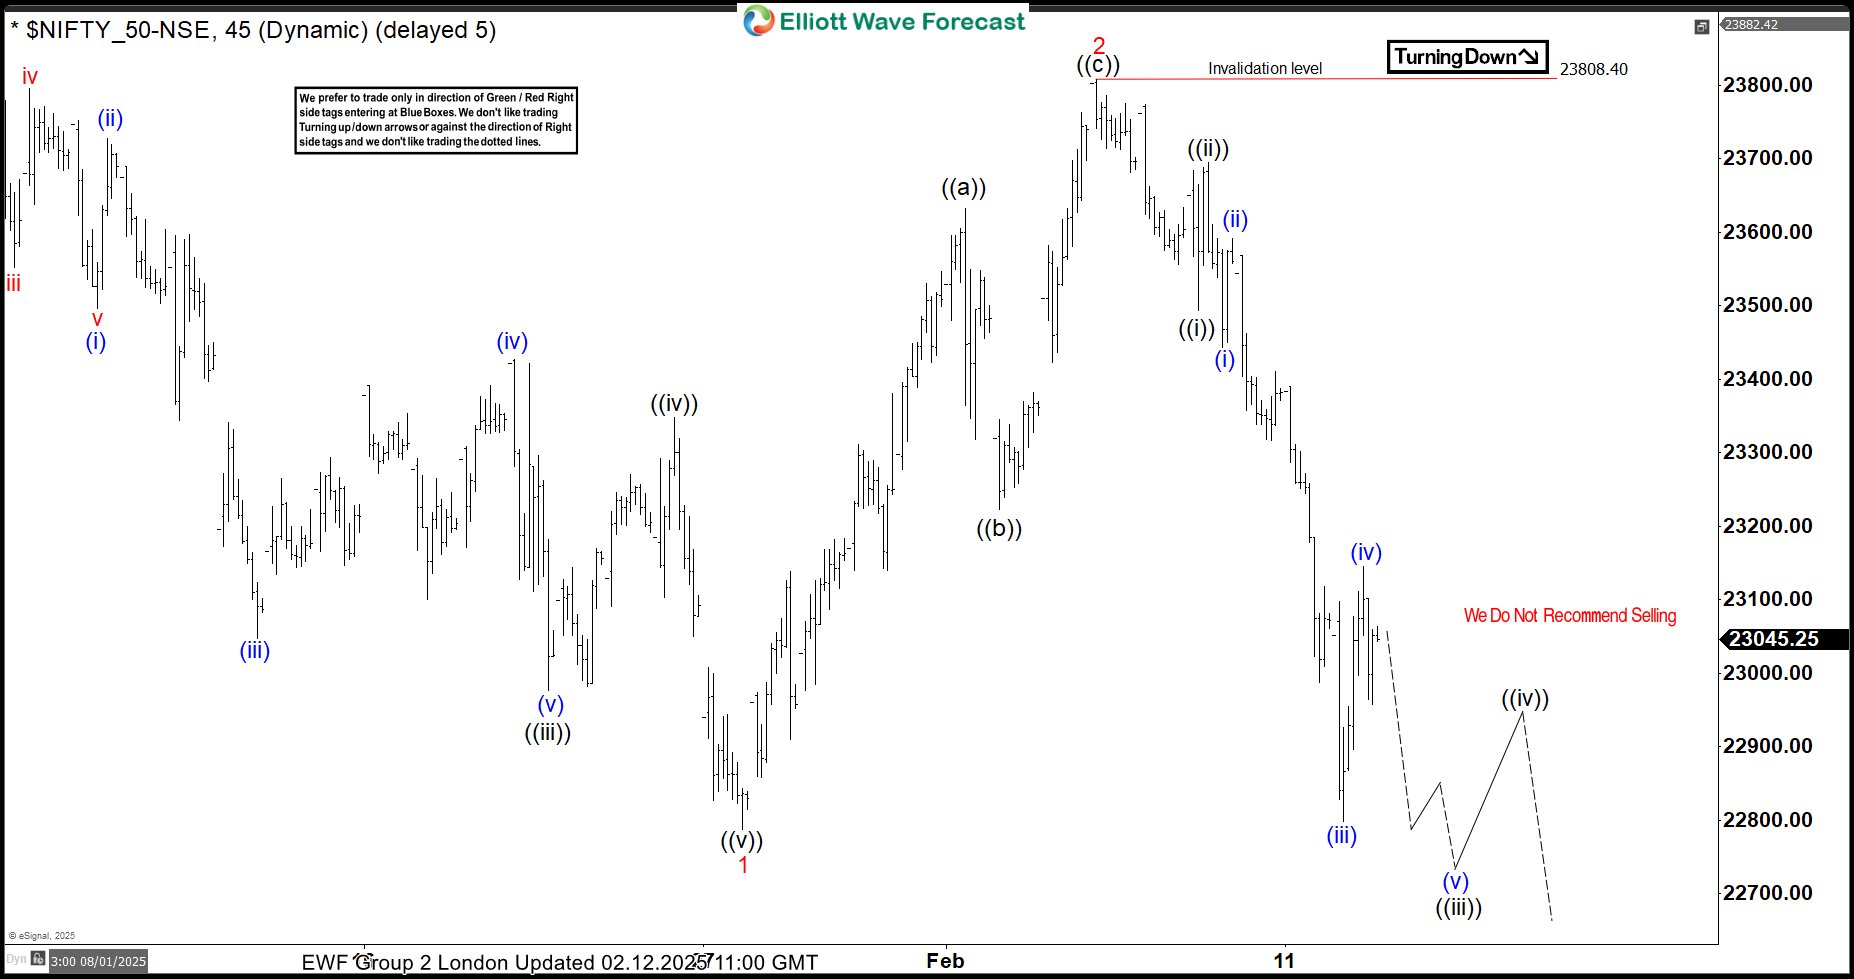
NIFTY chart update showing retest of previous lows
Elliott Wave Forecast Membership
Trade with a clear plan — not guesswork.
At Elliott Wave Forecast, our team of professional analysts monitors 78 instruments across global markets every day, helping members identify high-probability opportunities and manage risk through a structured, rules-based trading process.
Inside your membership, you’ll receive:
✅ Real-Time Trading Recommendations — with clearly defined Entry, Stop Loss, and Take Profit levels for each setup.
✅ Live Trading Room Access — follow professional trade setups as they develop in real time.
✅ 24-Hour Chat Room Support — ask unlimited questions and receive guidance from experienced analysts throughout the trading week.
✅ Expert Multi-Market Analysis — covering Forex, Stocks, Indices, ETFs, Commodities, and Cryptocurrencies.
✅ Exclusive Educational Videos — included at no additional cost, with practical lessons on Elliott Wave theory, trading strategies, risk management, and trade execution.
✅ Learn the Process Behind Every Setup — understand how experienced analysts identify opportunities, define risk, and manage trades as market conditions evolve.
Ready to see how the process works in real market conditions?
Regular 14-Day Trial: $9.99
Limited-Time Price: Only $0.99
👉 Start Your 14-Day Trial for Only $0.99





