

In this technical article we’re going to take a quick look at the Elliott Wave charts of Netflix Stock (NFLX) , published in members area of the website. As our members are aware, NFLX recently completed a correction against the 583.7 low. We saw a clear 3-wave pullback, wave (4), followed by the expected rally. In this post, we will explain the Elliott Wave count in detail.
NFLX 1-Hour Chart Analysis: January 19, 2025
The current view suggests that Netflix stock completed a 3-wave pullback from the peak to the low, labeled as wave (4) blue. A rally followed from this low, appearing impulsive. We have labeled this short-term cycle as wave ((i)) black, marking the start of a new bullish cycle. We expect Netflix stock to continue attracting intraday buyers in 3, 7, and 11 swings, as long as the price stays above ((ii)), and more importantly, above the (4) blue low of 823.5.
90% of traders fail because they don’t understand market patterns. Are you in the top 10%? Test yourself with this advanced Elliott Wave Test

NFLX 1-hour chart showing completed wave (4) correction and new bullish cycle
NFLX 1-Hour Post-Market Update: January 21, 2025
Netflix held above the 823.5 low as expected and made a sharp rally toward new highs. The structure from the 823.5 low looks impulsive. We believe this rally is wave ((iii)) of 3, known among Elliott Wave practitioners as the strongest wave. At some point, we expect a 3-wave pullback in wave 4 (red), which should present new buying opportunities.
Reminder for members: Our chat rooms in the membership area are available 24 hours a day, providing expert insights on market trends and Elliott Wave analysis. Don’t hesitate to reach out with any questions about the market, Elliott Wave patterns, or technical analysis. We’re here to help.
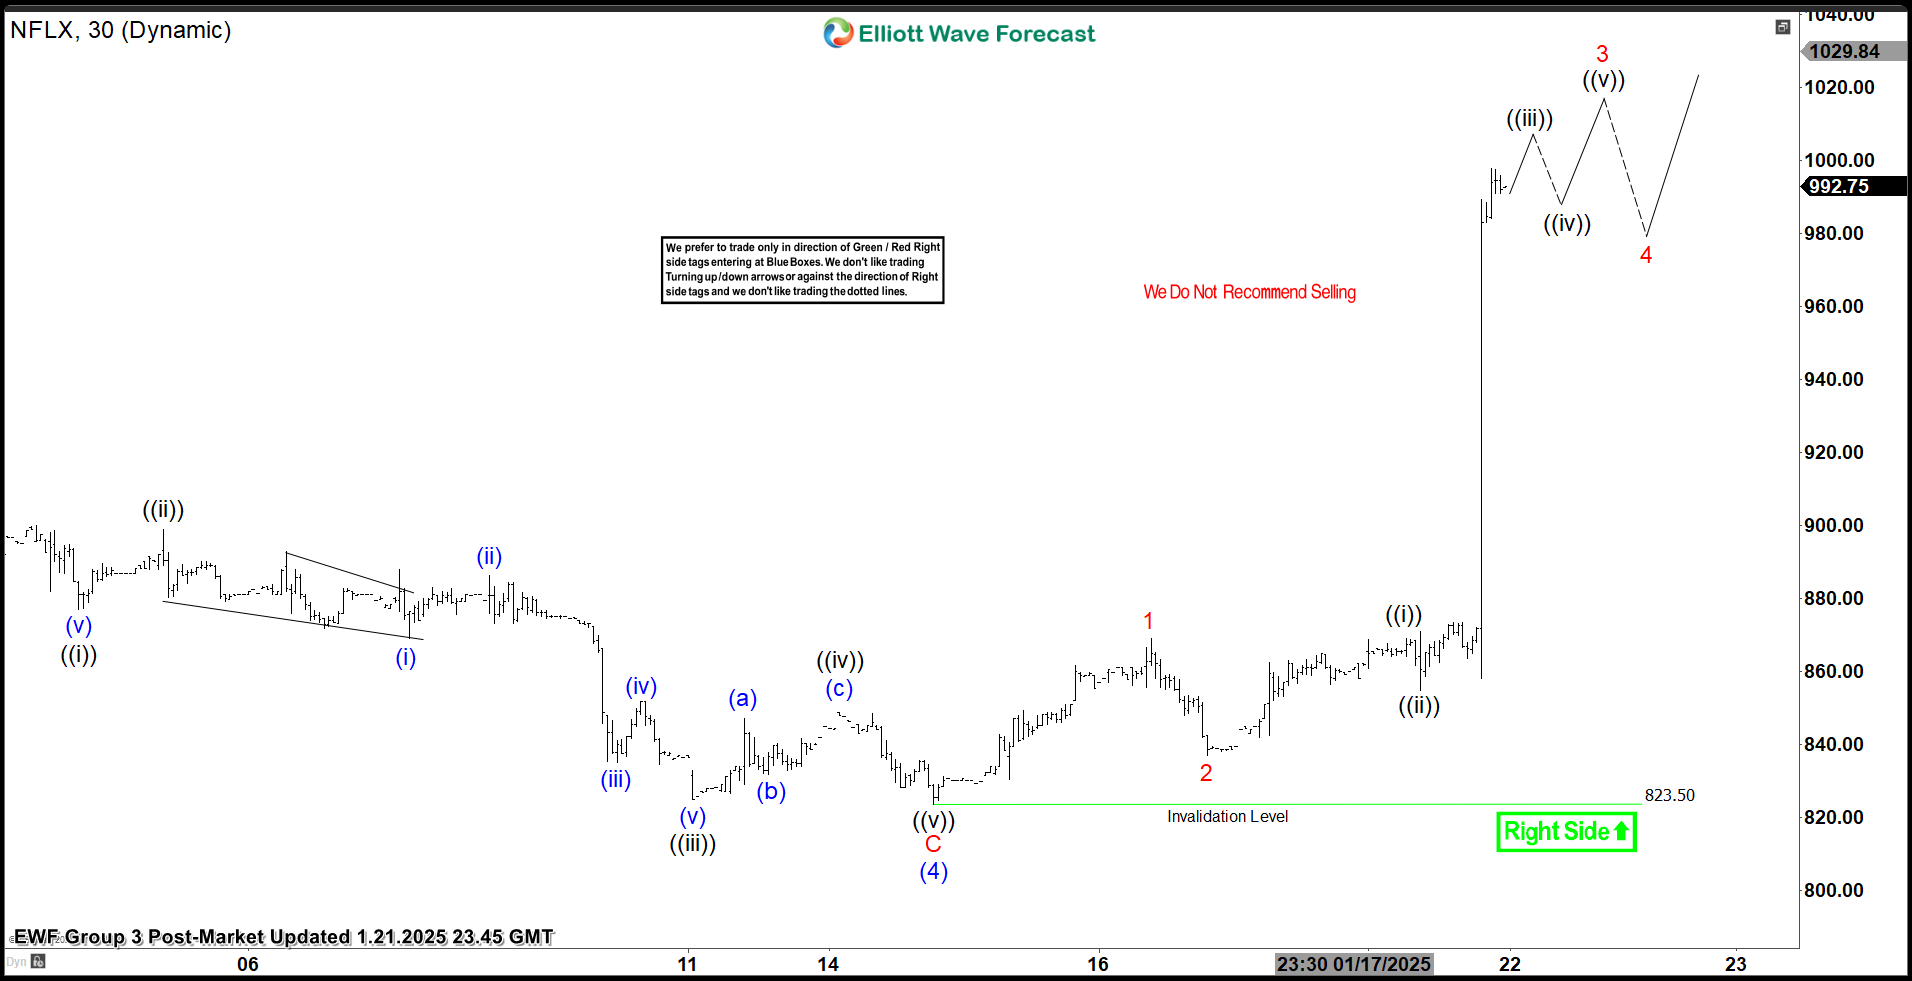
NFLX post-market update confirming impulsive wave ((iii)) progression
Elliott Wave Forecast Membership
Trade with a clear plan — not guesswork.
At Elliott Wave Forecast, our team of professional analysts monitors 78 instruments across global markets every day, helping members identify high-probability opportunities and manage risk through a structured, rules-based trading process.
Inside your membership, you’ll receive:
✅ Real-Time Trading Recommendations — with clearly defined Entry, Stop Loss, and Take Profit levels for each setup.
✅ Live Trading Room Access — follow professional trade setups as they develop in real time.
✅ 24-Hour Chat Room Support — ask unlimited questions and receive guidance from experienced analysts throughout the trading week.
✅ Expert Multi-Market Analysis — covering Forex, Stocks, Indices, ETFs, Commodities, and Cryptocurrencies.
✅ Exclusive Educational Videos — included at no additional cost, with practical lessons on Elliott Wave theory, trading strategies, risk management, and trade execution.
✅ Learn the Process Behind Every Setup — understand how experienced analysts identify opportunities, define risk, and manage trades as market conditions evolve.
Ready to see how the process works in real market conditions?
Regular 14-Day Trial: $9.99
Limited-Time Price: Only $0.99
👉 Start Your 14-Day Trial for Only $0.99



