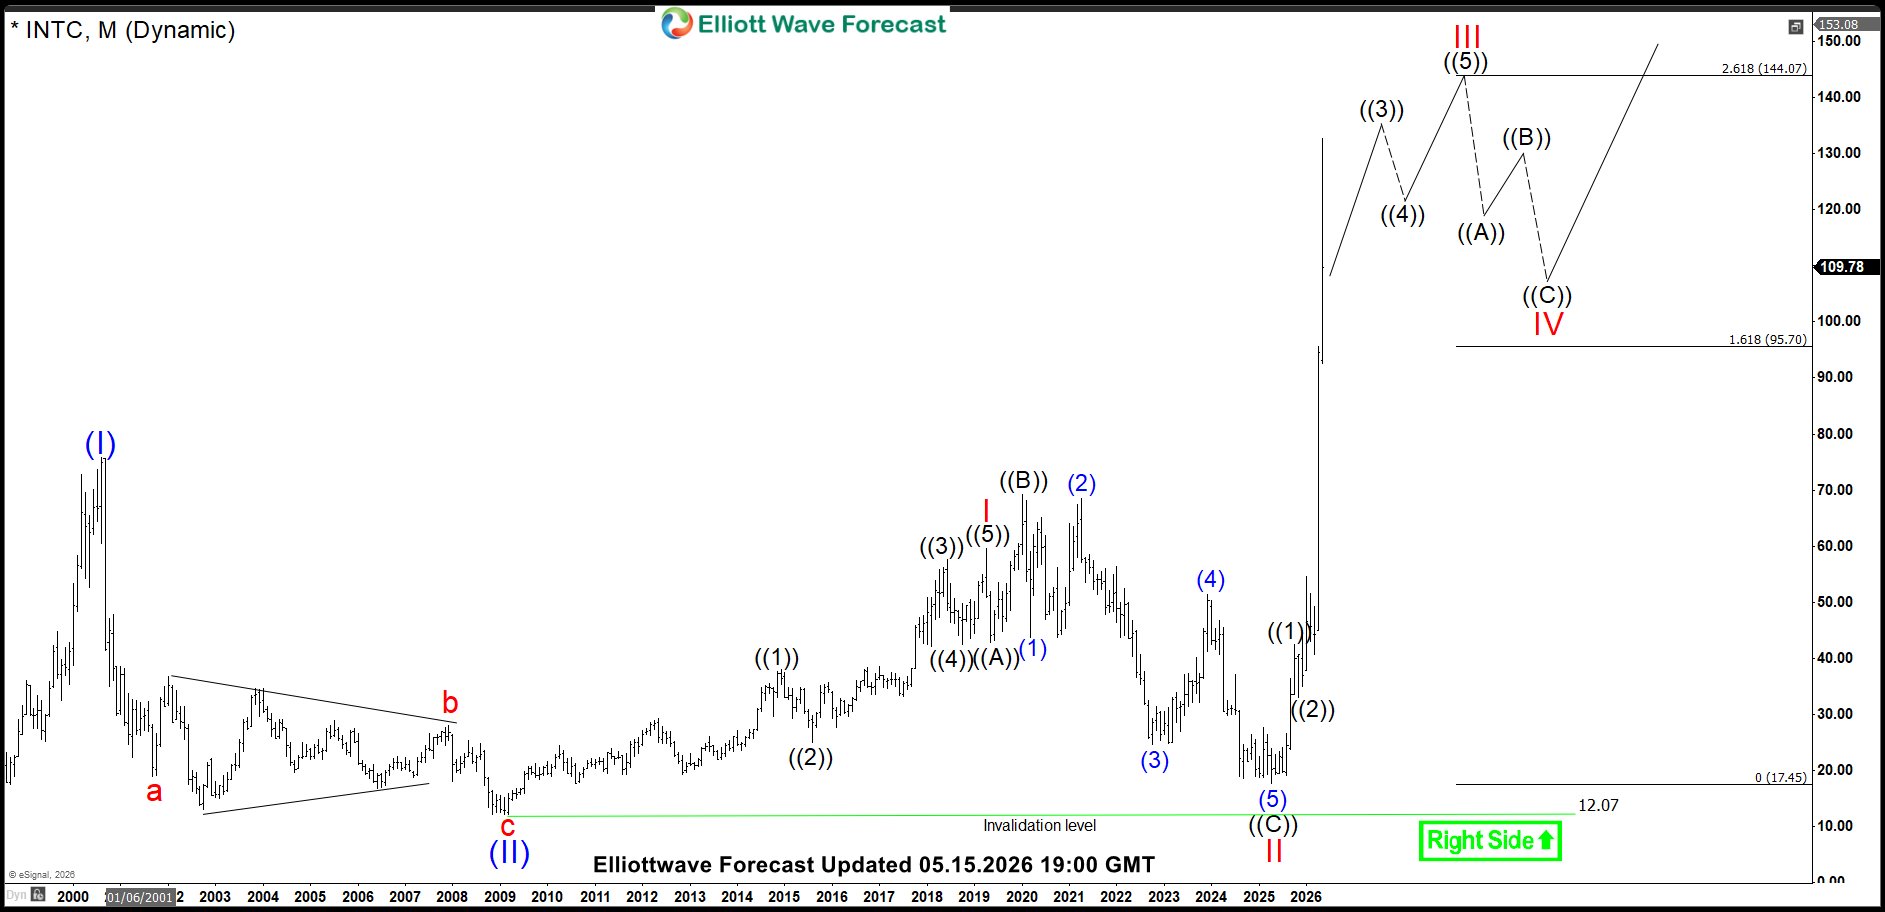
The current trajectory of the semiconductor market suggests a significant “changing of the guard” in the AI sector, as capital rotates from the first-wave GPU dominance of Nvidia into the foundational infrastructure plays of Intel (INTC) and AMD. This shift is not merely a product of market sentiment but is deeply reflected in the technical structures of the current rally. From an Elliott Wave perspective, Intel appears to be transitioning out of a multi-year corrective phase and into a powerful Wave 3 rally, driven by the structural validation of its strategies and landmark foundry agreements. Our INTC blog back in 2020, called for the same rally to take place and it is finally happening 4-5 years later. Let’s take a look at the montly and daily charts to dissect the most recent rally.
INTC (Intel) Long-term Elliott Wave Analysis
INTC (Intel) ended a major correction back in 2009 and rallied impulsively to a high of $59.59 in April 2019. We labelled this rally as wave I of a bullish wave (III). It then started a pull back which took the form of an expanded FLAT Elliott wave correction and retraced more than 76.4% of wave I rally. Wave II completed back in April 2025 and since then it has gained over 700% and appears to be still within wave ((3)) or within wave ((4)) of III. 261.8% Fibonacci extension of wave I – II comes at 144.07 and is the ideal area to complete wave III.
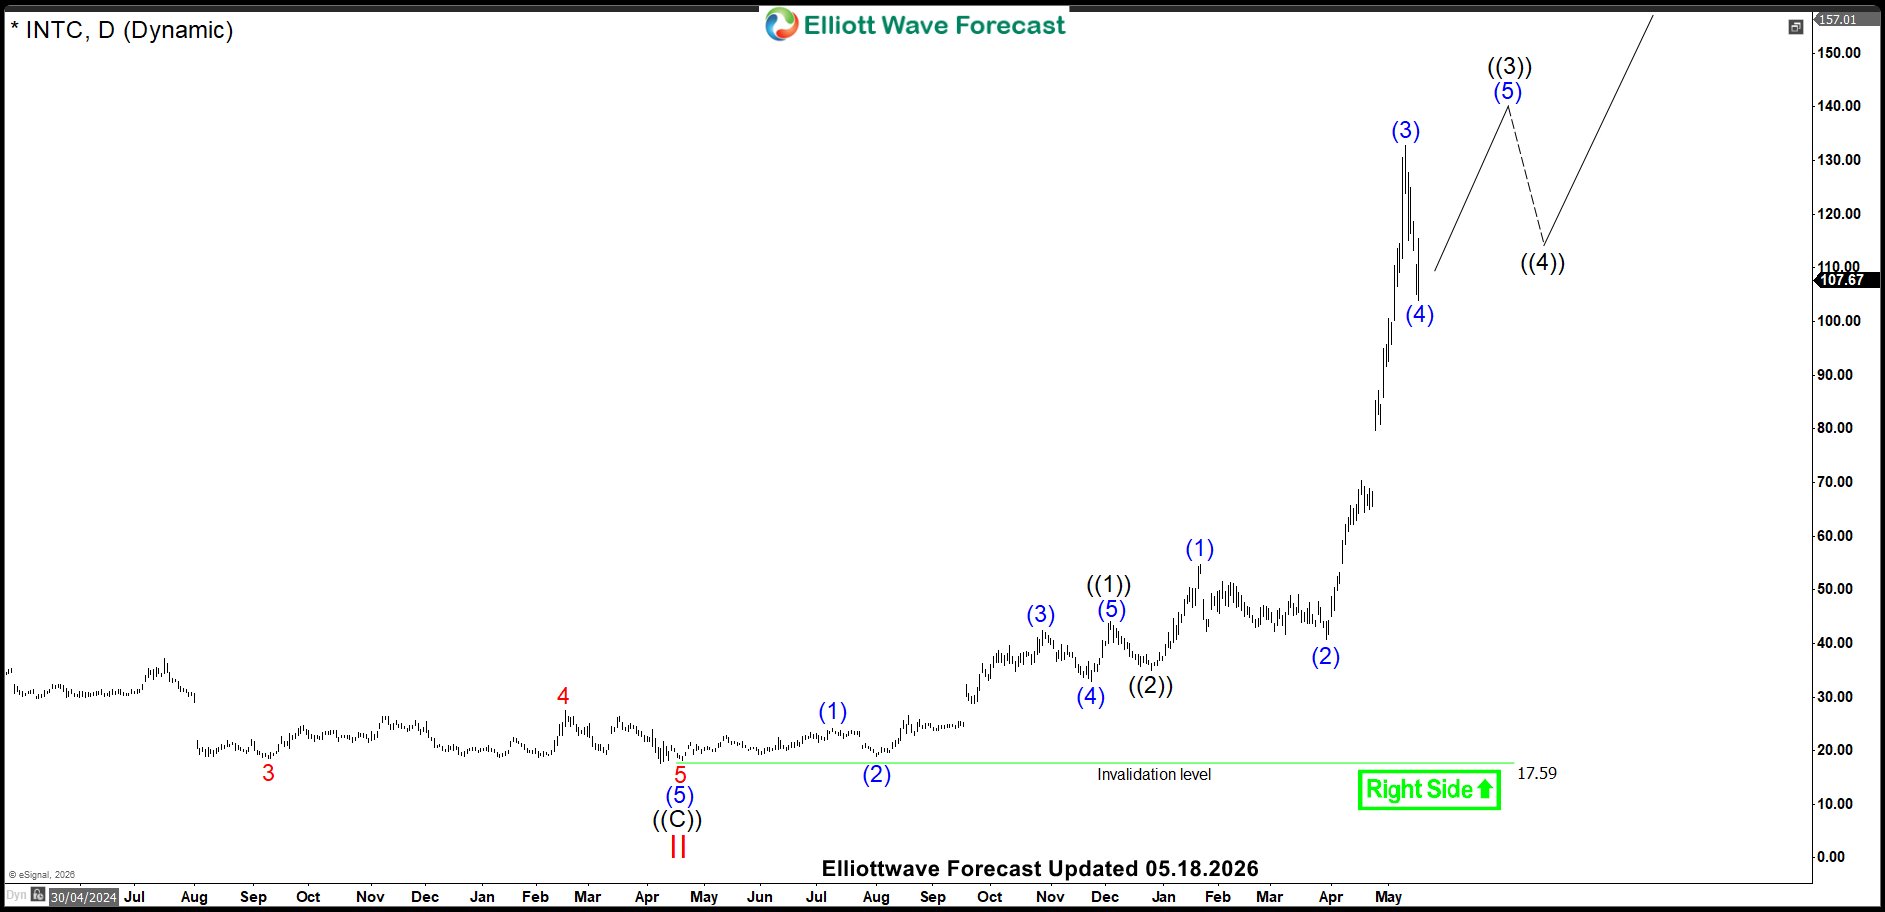
INTC (Intel) Daily Chart Elliott Wave Analysis
Daily chart of Intel below shows structure of the rally up from April 2025 wave II low. Wave ((1)) ended at $43.28, wave ((2)) completed at $34.95, wave (1) of ((3)) completed at $54.60, wave (2) of ((3)) completed at $40.63, wave (3) of ((3)) completed at $132.75 and we are currently in wave (4) pull back, once completed, it should look for a new high to end wave ((3)) before pulling back in wave ((4)) and resuming the rally to complete the cycle from April 2025 low.
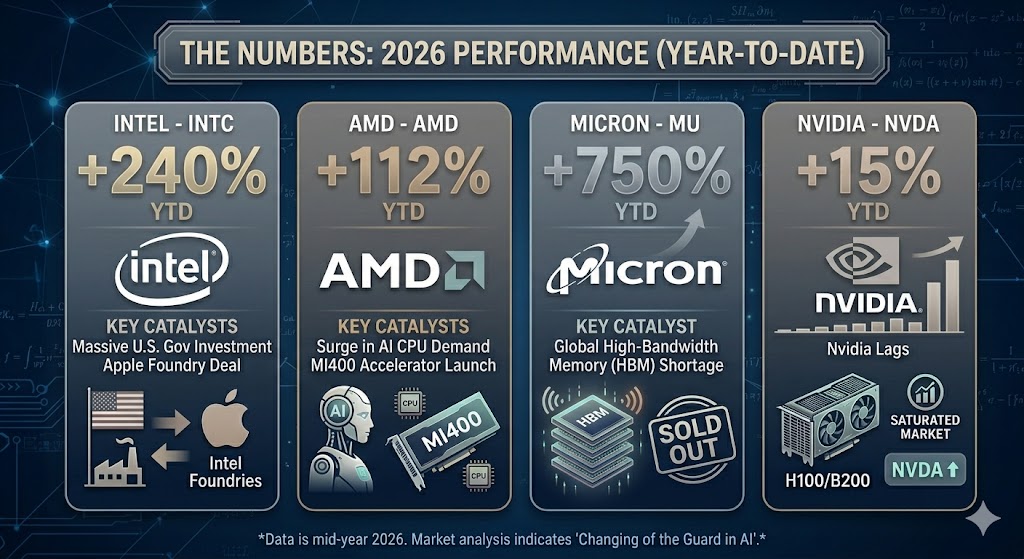
2026 Performance (Year-To-Date)
We can see Intel (INTC) has gained 240% Year-to-date and is in 2nd place behind Micron (MU) which has gained 750% year-t0-date whereas NVDA is in last place having gained only 15% year-t0-date due to saturated market and China not buying advanced NVDA chips despite US government clearance