Fortinet (NASDAQ: FTNT) extended its upside move above our previous $140 target. Today, we analyze the current Elliott Wave structure. Our analysis focuses on this upside extension and the projected target for the current cycle.

Fortinet is currently within the strongest leg of its impulsive cycle. The stock is extending higher in wave (3) of ((3)) of III. It broke above the $140 target area. The nesting structure from the lows continues unfolding as expected. This strong third wave ideally reaches the 1.618 Fibonacci extension at $184. The cycle usually pushes prices beyond that target. Consequently, we expect the stock to remain supported during wave IV pullbacks. Then, it will look for another extension in wave V.

Fortinet’s incomplete bullish sequence suggests wave III will extend further above the $180 golden ratio. Eventually, it should break above $200 as the five-wave structure unfolds.

Fortinet FTNT Weekly Chart 7.3.2026

FTNT Weekly Chart

Conclusion

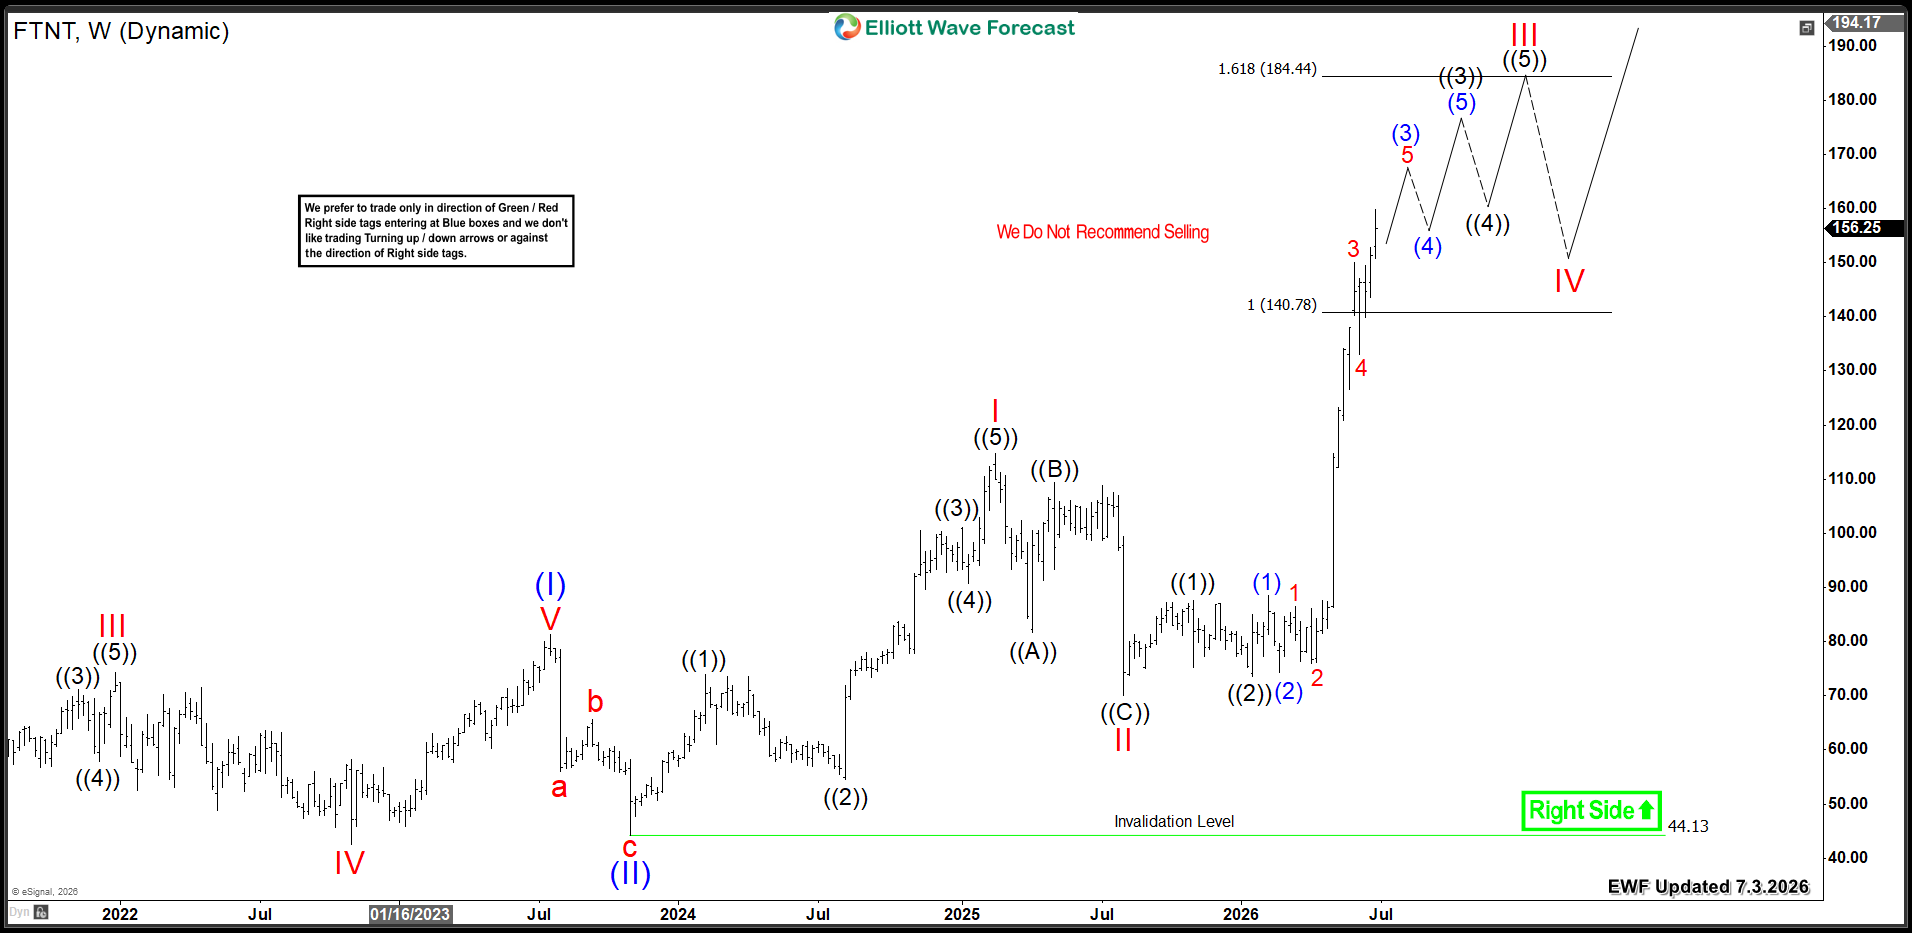
FTNT’s impulsive bullish cycle operates at full power and the stock continues seeking further upside extension. Therefore, investors should target buying opportunities within daily and weekly pullbacks.

Get More Insights Today

Learn to trade our Blue Boxes using the 3, 7, or 11 swings sequence. Try our services with a 14-day trial.

You will gain access to:

  • 78 instruments updated across 4 different time frames

  • Live Trading & Analysis Sessions with our Expert Analysts every day

  • 24-hour chat room support and much more

Explore our system to gain deeper insights into this methodology.

Elliott Wave Forecast Trial