

Dell Technologies (NYSE: DELL) continues to validate the bullish Elliott Wave outlook discussed in our previous analysis. In the first chart, we anticipated that the rally into wave ((1)) would be followed by a corrective pullback in wave ((2)). At the same time, we expected buyers to reappear above the invalidation level and push the stock higher again. That scenario unfolded exactly as anticipated. After completing wave ((1)), Dell entered a pullback and found support well above the invalidation level at $66.34.
The stock then resumed higher from the blue box reaction area and produced a strong impulsive rally. Since the wave ((2)) low, Dell has gained nearly 170%, confirming the strength of the bullish sequence.
DELL Elliott Wave Counts from 10.27.2025
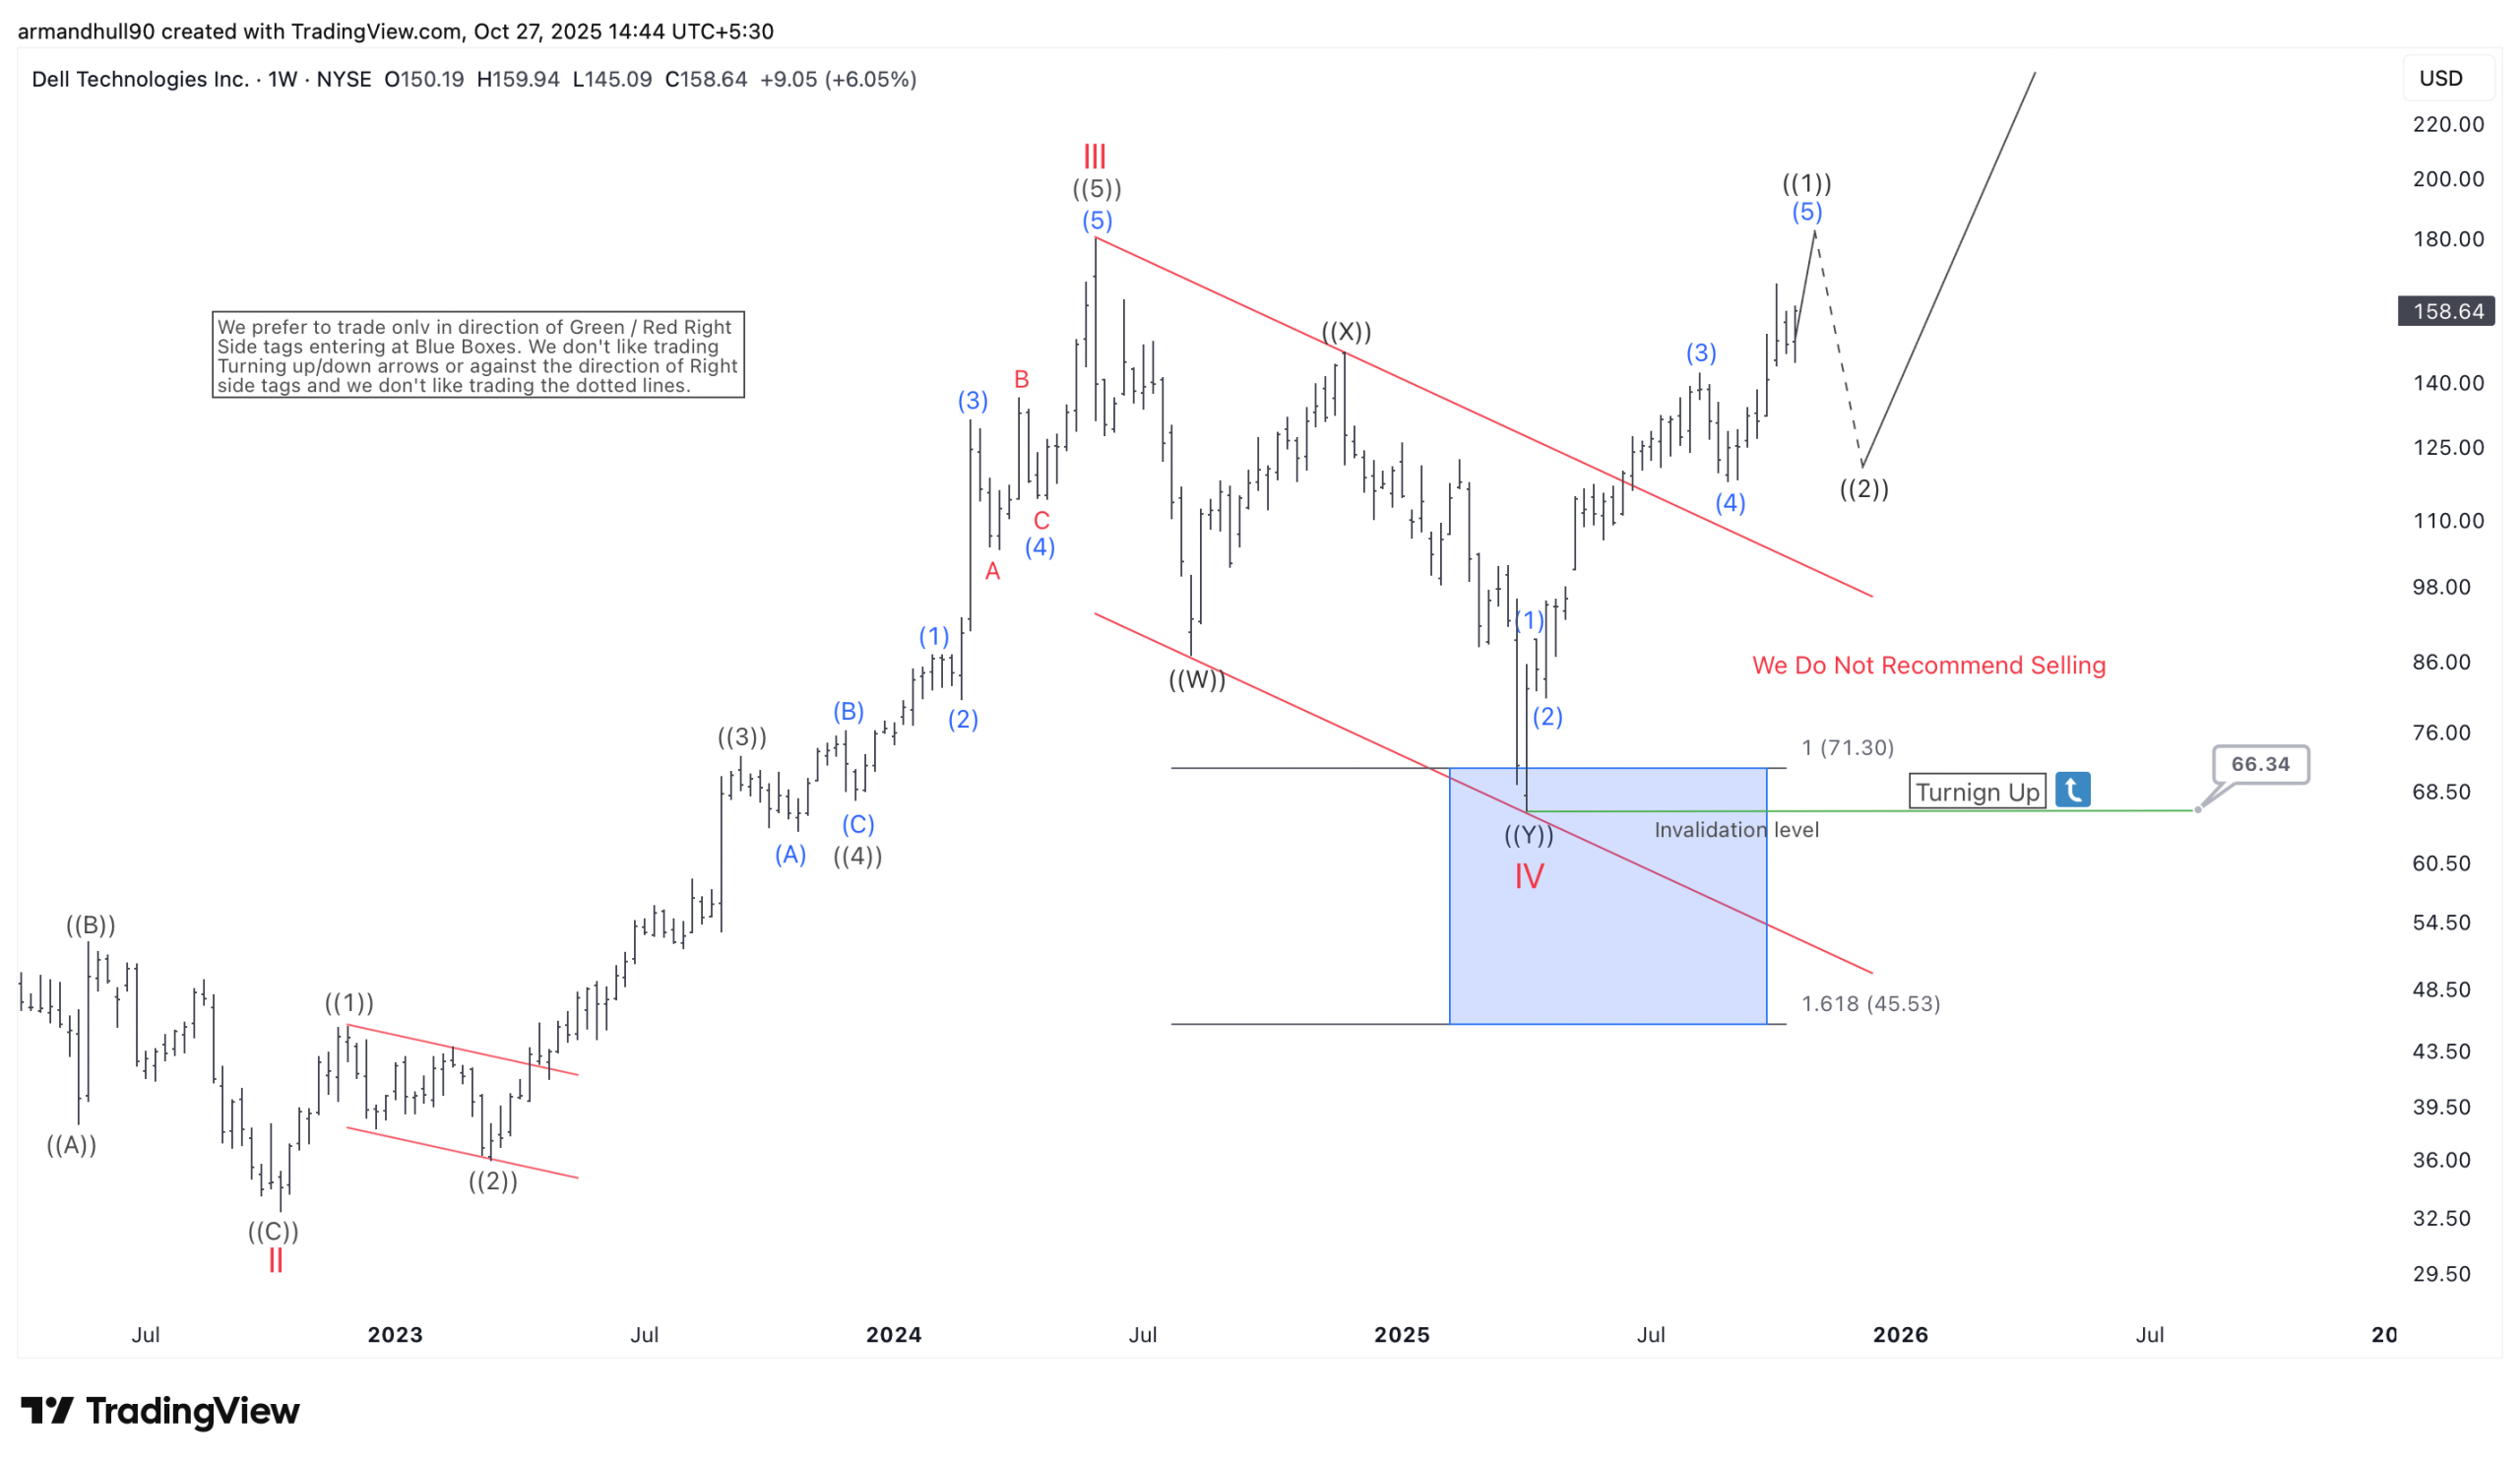
Previously, we identified the blue box area as a high-probability support zone during wave IV. The correction unfolded as a clear double three structure labeled ((W))-((X))-((Y)). In addition, the decline respected the red corrective channel throughout the entire move. Once price reached the blue box area, buyers stepped in aggressively. As expected, Dell turned sharply higher and broke out from the corrective channel. This bullish reaction confirmed that wave IV had completed and that the next impulsive sequence had already started.
This now shows how accurately the Elliott Wave structure guided the market direction. The rally developed exactly in line with our forecast after the completion of wave ((2)).
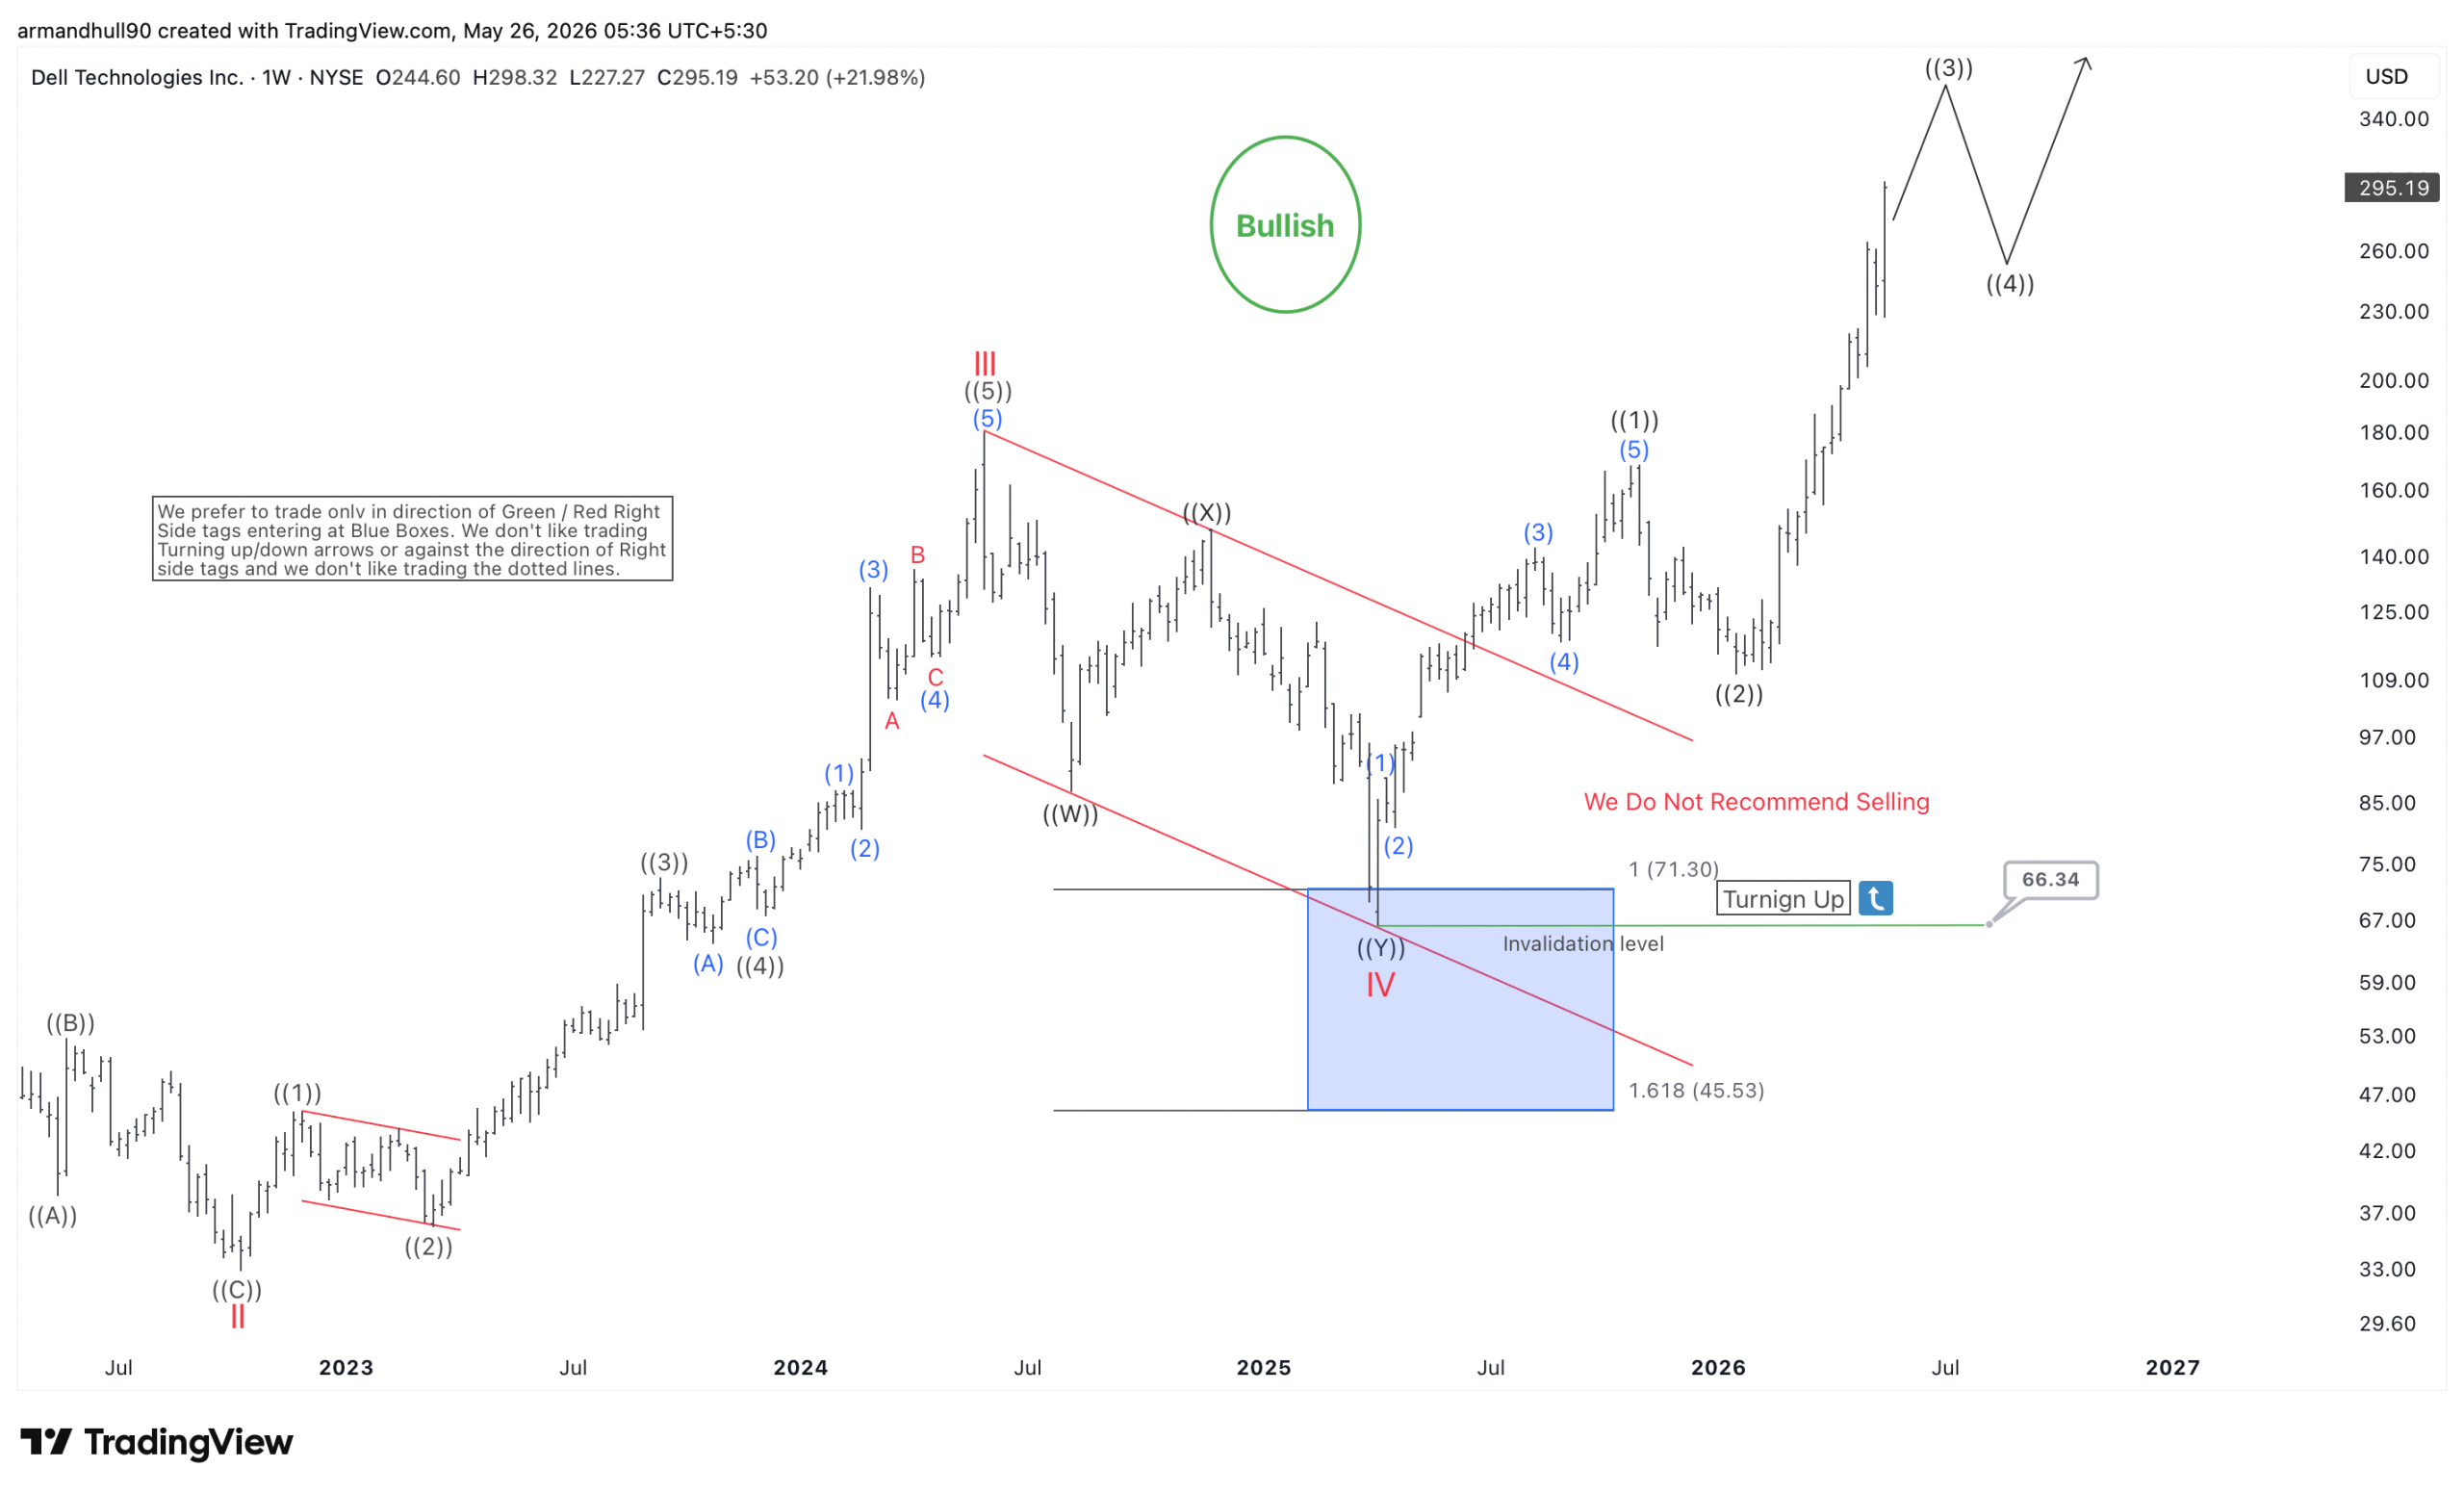
Current Elliott Wave Structure
The latest chart suggests that Dell is now extending higher within larger degree wave V. Inside this sequence, wave ((1)) and wave ((2)) already appear complete. The stock is currently progressing within wave ((3)), which is typically the strongest portion of an impulsive move.
So far, Dell has already achieved the equal legs extension target within this advance. However, we still expect a little more upside before calling wave ((3)) complete. Once this rally finishes, the stock could enter a pullback in wave ((4)).
What Comes Next?
The expected retracement in wave ((4)) may provide another buying opportunity. We prefer buying the pullback at the extreme areas in 3, 7, or 11 swings. As long as the structure remains above 66.34, the long-term outlook stays bullish. After wave ((4)) completes, we expect another advance in wave ((5)) of V. This final leg could also extend higher before the larger cycle ends. Therefore, we continue to favor the upside and do not recommend selling against the trend at this stage.
About Elliott Wave Forecast
At www.elliottwave-forecast.com, we update one-hour charts four times daily and four-hour charts once daily for all 78 instruments. We also conduct daily live sessions to guide clients on the right side of the market. Additionally, we have a chat room where moderators answer market-related questions. Experience our service with a 14-day trial for only $0.99. Cancel anytime by contacting us at support@elliottwave-forecast.com.


