Baidu (NASDAQ: BIDU) has declined 20% year-to-date, underperforming the broader market. However, the stock now shows signs of bottoming. Today, we analyze the Elliott Wave structure behind this pullback. Our analysis reveals BIDU is approaching its next technical reversal zone. We also explain the potential bullish path ahead for the stock.
Elliott Wave Analysis
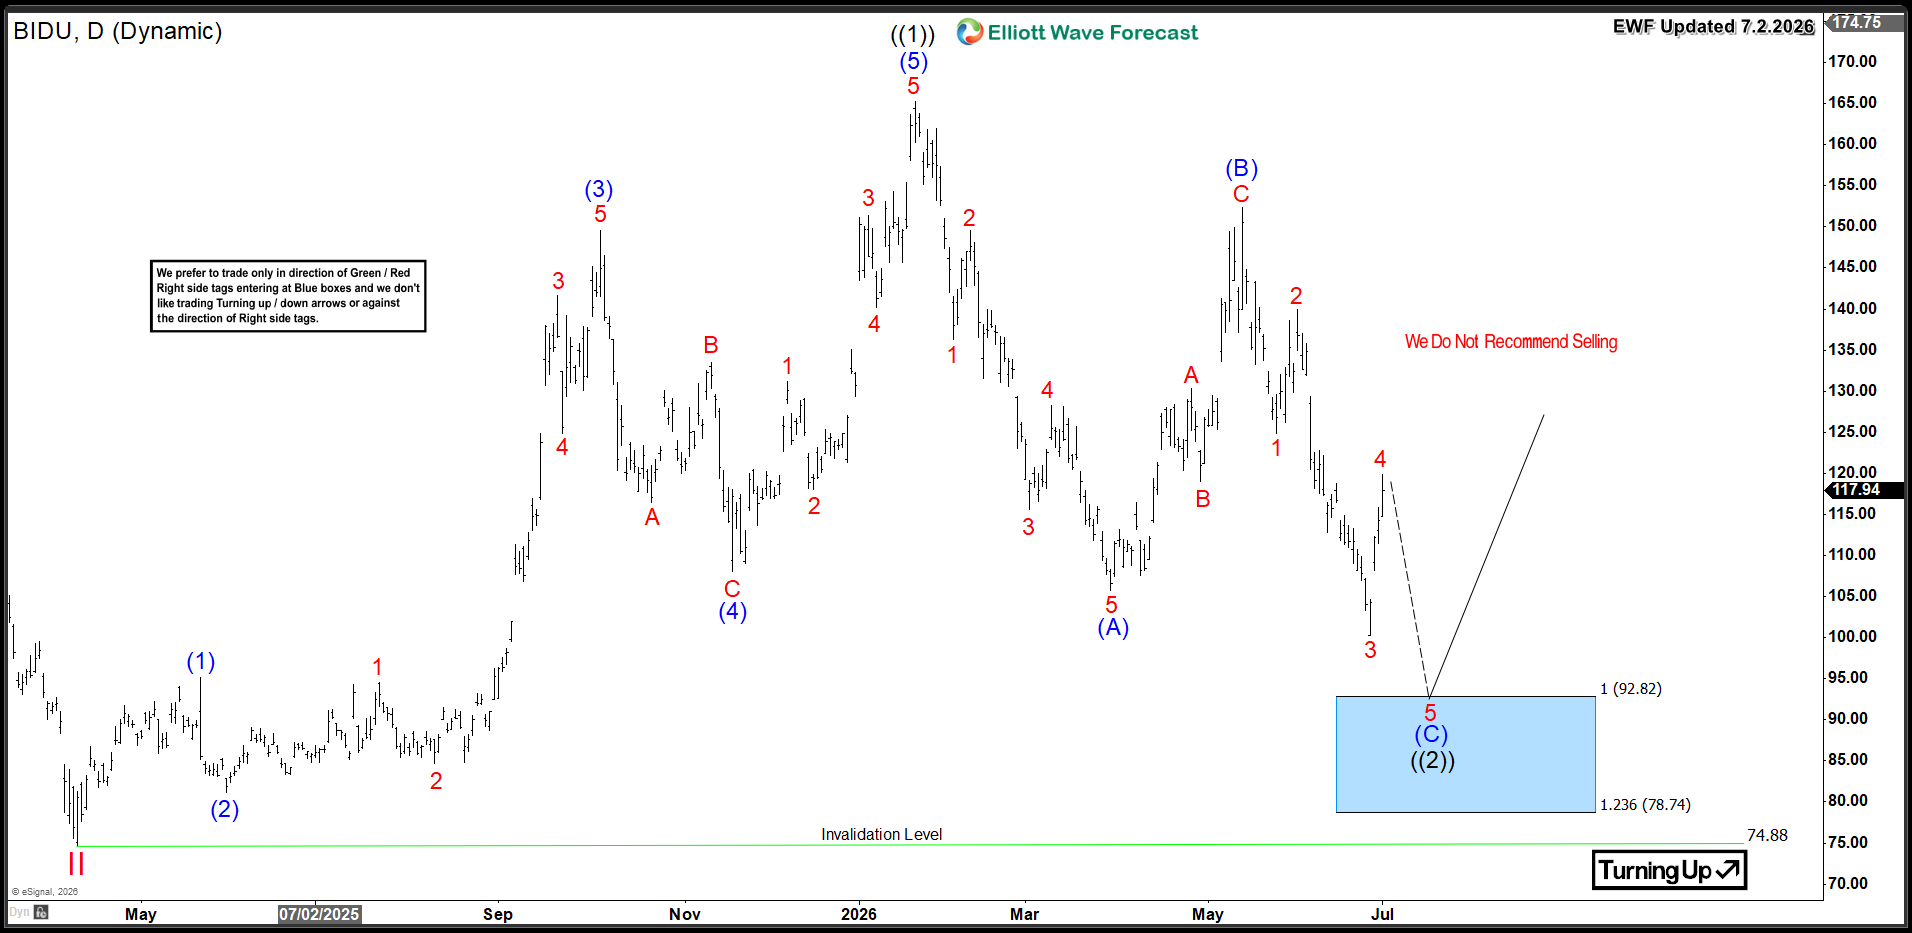
BIDU Daily Chart 7.2.2026
Conclusion
Baidu’s daily correction is entering its final phase, with a potential dip below $100 to complete the move lower and reach the buying area, so traders should focus on strategic entry points during this corrective dip while anticipating a reversal by year end.
Get More Insights Today
Learn to trade our Blue Boxes using the 3, 7, or 11 swings sequence. Try our services with a 14-day trial.
You will gain access to:
-
78 instruments updated across 4 different time frames
-
Live Trading & Analysis Sessions with our Expert Analysts every day
-
24-hour chat room support and much more
Explore our system to gain deeper insights into this methodology.


