Hello traders. In this technical article, we will review the Elliott Wave forecast for the SPDR S&P Metals & Mining ETF (XME) that we recently presented to our members.
XME has been forming a three-wave correction, with the price making a significant decline during the Wave C leg, as we forecasted. In this article, we will review the Elliott Wave structure and the forecast we presented to our members.
XME Elliott Wave 1-Hour Chart – 09.09.2026
XME is correcting the cycle from the 96.42 low. At the time of the original forecast, the correction appeared incomplete. We could count five waves down from the peak, suggesting that another leg lower could develop. Based on this structure, we expected the correction to continue as a potential Zig Zag pattern, labeled (A)-(B)-(C).
The official trading strategy for identifying 3, 7, and 11 swings and Equal Legs setups is explained in detail in our educational video. The video is available exclusively to members inside the membership area.
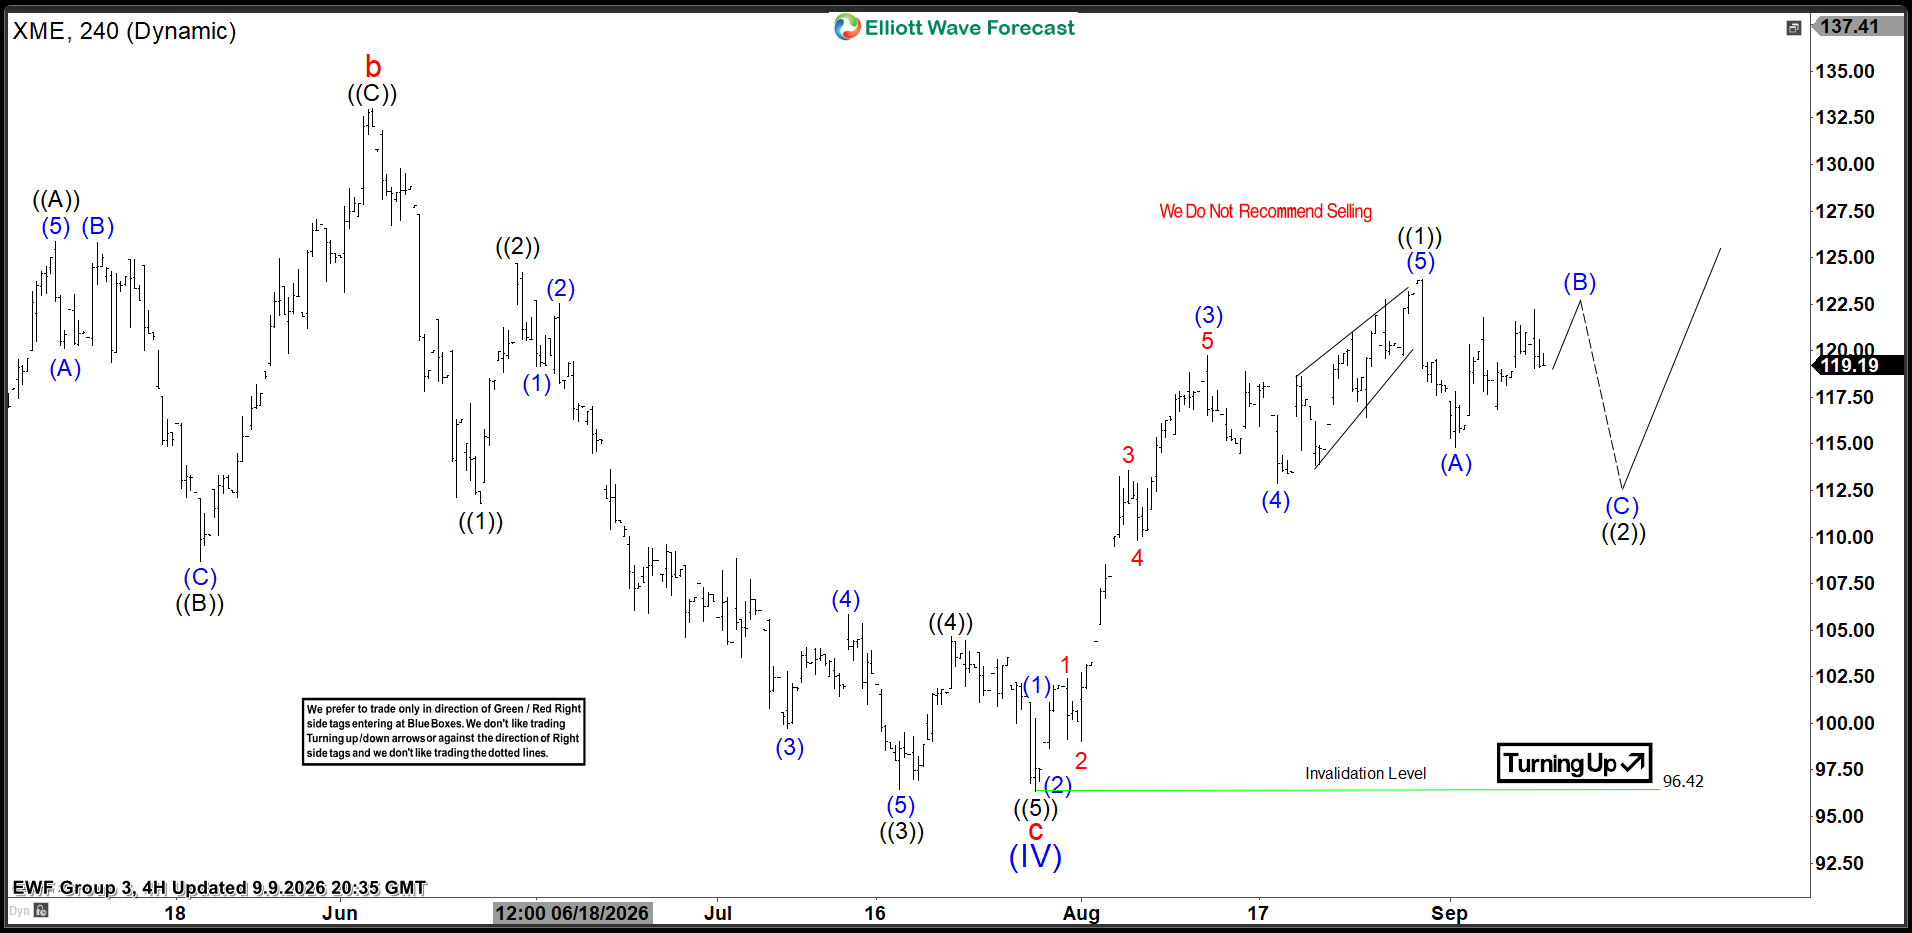
XME Elliott Wave 1-Hour Chart – 09.09.2026
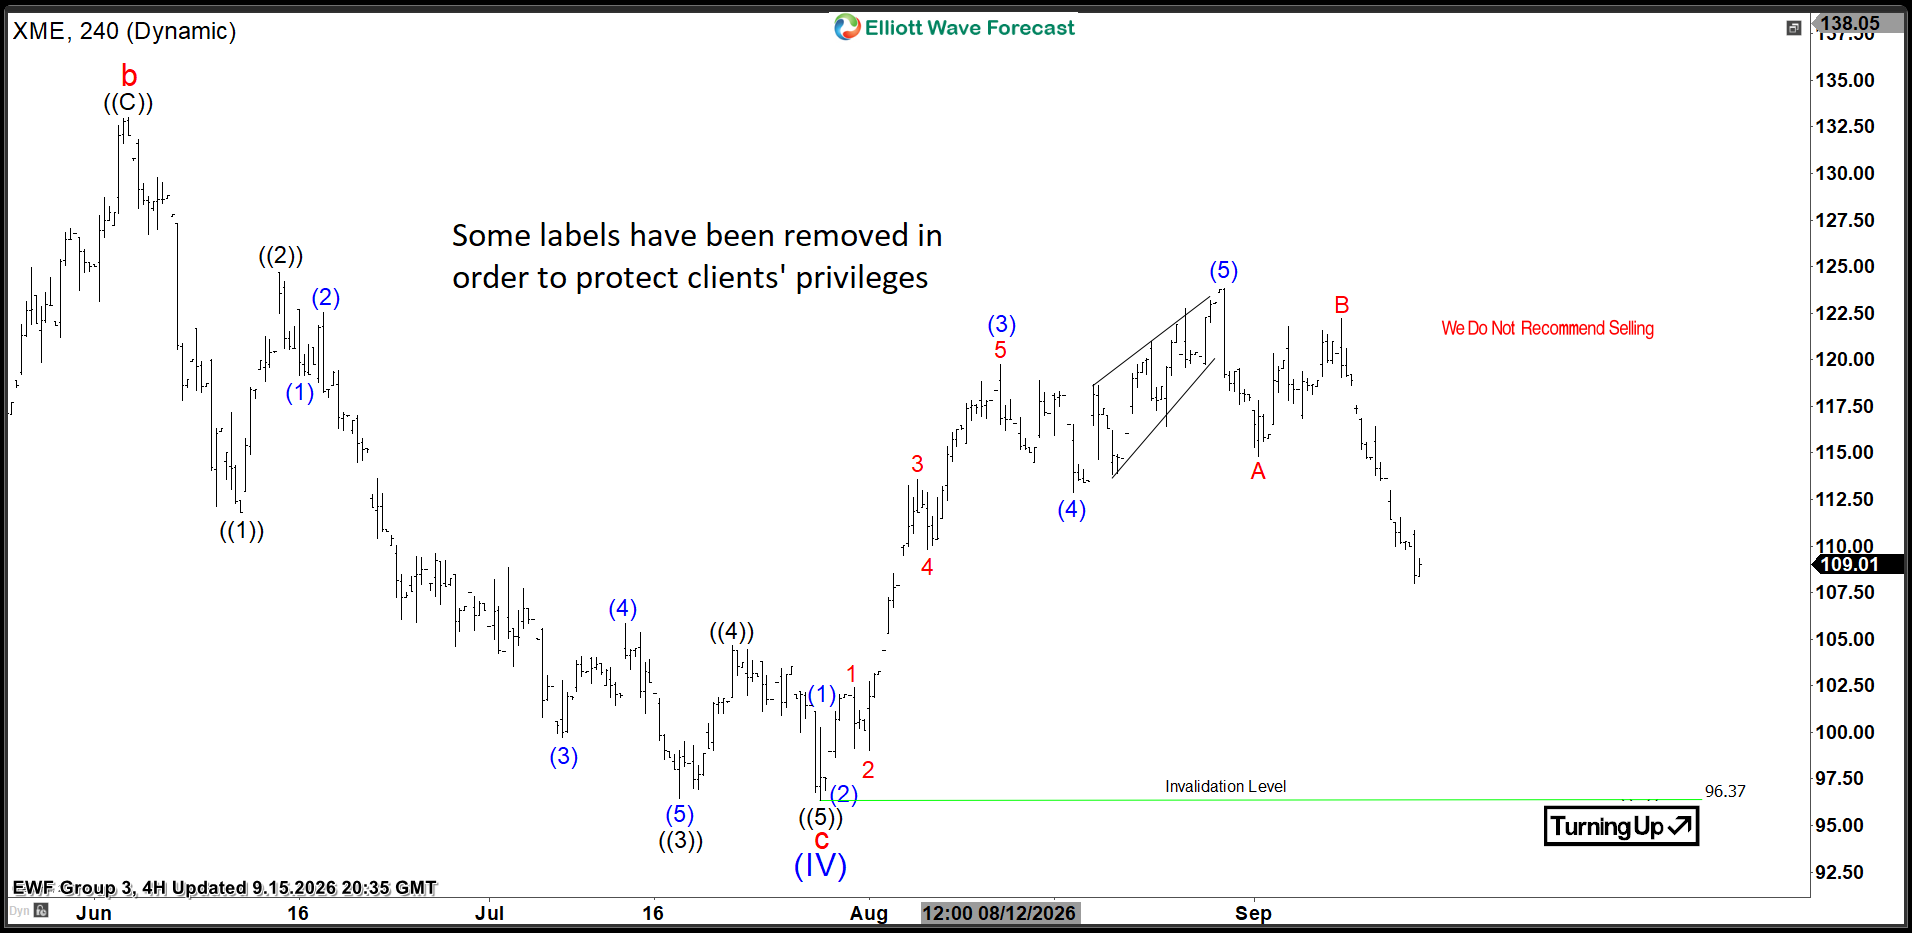
XME has continued lower and made another five-wave leg down, as expected. The price has now reached the extreme zone at 113.15–107.56 . From this area, we can see a bounce developing in at least three waves. We will continue to monitor the structure to see how the price reacts from this zone and whether it can confirm the next phase of the correction.
Keep in mind that the market is dynamic, and the outlook may have changed in the meantime. Our member Chat Rooms are open 24 hours a day, Monday through Friday, on trading days, providing ongoing expert guidance on market trends and Elliott Wave analysis. Members can ask questions about market structure and technical setups at any time during trading days.
For exclusive market updates, additional trading insights, and special discount codes, follow me on X and Stocktwits.
Have a question or want to check current promotional offers? Feel free to send me a direct message anytime.
Thank you for exploring our XME technical article with us. While we analyze 78 instruments, it’s important to remember that not every chart represents a trading recommendation. For official trading signals, we invite you to join our Live Trading Room, where we provide actionable insights in real-time. If you’re not yet a member, take advantage of our 14-day trial to unlock new trading opportunities.
Over the years, we’ve developed a reliable trading strategy that clearly defines entry, stop loss, and take profit levels. By joining us, you’ll gain access to expert guidance and the chance to refine your trading skills
Join us today !
 Elevate your trading with Elliott Wave Forecast!
 Ask unlimited questions during trading hours (Monday to Friday). Our Chat Rooms are an excellent place to learn, with continuous support from our market experts!
 Explore our expert insights and real-time analysis covering Forex, Indices, Commodities, Cryptocurrencies, Stocks, and ETFs across 78 instruments.
 Gain exclusive access to our Official Trading Recommendations in the Live Trading Room, where seasoned experts provide valuable insights and guidance on new trading opportunities.
 For just $0.99, unlock a wealth of knowledge and experience with our 14-day Trial. Experience firsthand our proven trading strategy, which accurately defines Entry, Stop Loss, and Take Profit levels, empowering you to make informed decisions with confidence.
 Ready to take the next step? Get your 14-day Trial in just a few clicks!